A list of cool Chrome DevTools Tips and Tricks
New Course Coming Soon:
Get Really Good at Git
The Chrome DevTools provide an amazing set of tools to help you develop on the Web platform. Here are a few tips you might not know yet
- Drag and Drop in the Elements panel
- Reference the currently selected element in the Console
- Use the value of the last operation in the Console
- Add CSS and edit the element state
- Find where a CSS property is defined
- Save to file the modified CSS
- Screenshot a single element
- Find an element using CSS selectors
- Shift-enter in the Console
- Clear the Console
- Go to…
- Watch Expression
- XHR/Fetch debugging
- Debug on DOM modifications
Check out the overview of Chrome DevTools if you’re new to them
Drag and Drop in the Elements panel
In the Elements panel you can drag and drop any HTML element and change its position across the page
Reference the currently selected element in the Console
Select a node in the Elements panel, and type $0 in the console to reference it.
Tip: if you’re using jQuery, you can enter
$($0)to access the jQuery API on this element.
Use the value of the last operation in the Console
Use $_ to reference the return value of the previous operation executed in the Console
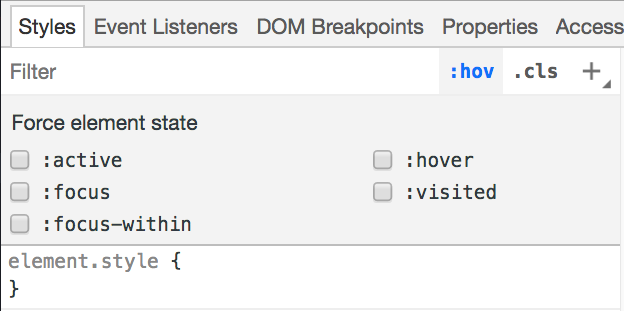
Add CSS and edit the element state
In the Elements panel there are 2 super useful buttons.
The first lets you add a new CSS property, with any selector you want but pre-filling the currently selected element:
The second one lets you trigger a state for the selected element, so you can see the styles applied when it’s active, hovered, on focus.
Find where a CSS property is defined
cmd-click (ctrl-click on Windows) a CSS property in the Elements panel, the DevTools will point you to the place where that is defined, in the Source panel
Save to file the modified CSS
Click the name of the CSS file that you edited. The inspector opens it into the Sources pane and from there you can save it with the live edits you applied.
This trick does not work for new selectors added using +, or into the element.style properties, but only for modified, existing ones.
Screenshot a single element
Select an element and press cmd-shift-p (or ctrl-shift-p in Windows) to open the Command Menu, and select Capture node screenshot
Find an element using CSS selectors
Pressing cmd-f (ctrl-f in Windows) opens the search box in the Elements panel.
You can type any string in there to match the source code, or you can also use CSS selectors to have Chrome generate an image for you:
Shift-enter in the Console
To write commands that span over multiple lines in the Console, press shift-enter.
Once you’re ready, press enter at the end of the script to execute it:
Clear the Console
You can clear the console using the Clear button on the top-left of the console, or by pressing ctrl-l or cmd-k.
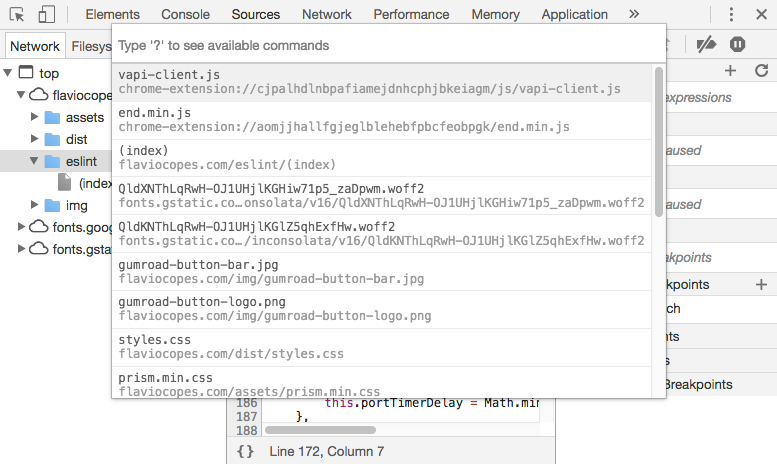
Go to…
In the Sources panel:
cmd-o(ctrl-oin Windows), shows all the files loaded by your page.cmd-shift-o(ctrl-shift-oin Windows) shows the symbols (properties, functions, classes) in the current file.ctrl-ggoes to a specific line.
Watch Expression
Instead of writing again and again a variable name or an expression you are going to check a lot during a debug session, add it to the Watch Expression list.
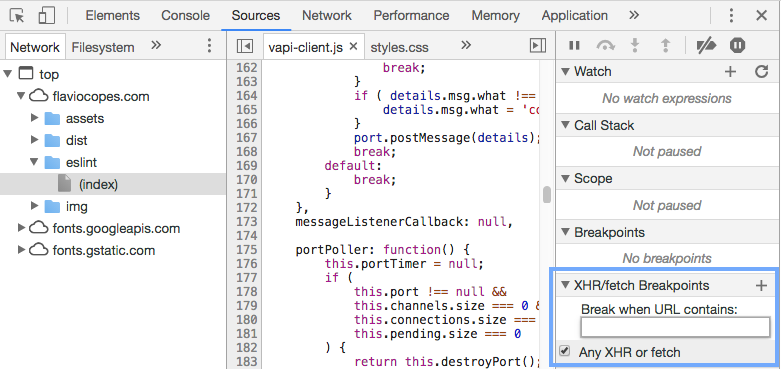
XHR/Fetch debugging
From the debugger open the XHR/Fetch Breakpoints panel.
You can set it to break any time an XHR / Fetch call is sent, or just on specific ones:
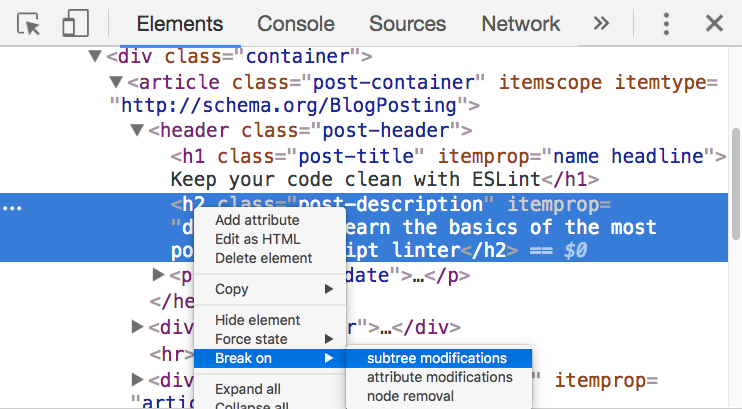
Debug on DOM modifications
Right-click an element and enable Break on Subtree Modifications: whenever a script traverses that element children and modifies them, the debugger stops automatically to let you inspect what’s happening.
Here is how can I help you:
- COURSES where I teach everything I know
- CODING BOOTCAMP cohort course - next edition in 2025
- BOOKS 16 coding ebooks you can download for free on JS Python C PHP and lots more
- Follow me on X