How to debug JavaScript code
A tutorial on how to use debugging to solve any JavaScript problem
Debugging is a great skill to learn how to solve every problem with your JavaScript code.
Every day we wake up, have a nice breakfast, head to the computer and there we sit, to write perfect code that does exactly what we want.
Then we wake up.
That would be ideal, right? But it was a dream.
As good as you can become, there’s no way you can write bug-free code. Code has bugs. By definition.
A bug is a problem that you did not see or anticipate when you set out to write the code.
A bug might be discovered only when you release your program to users, and that’s the worse situation.
A bug can be discovered by yourself when you test the program, and it might even happen when things - working perfectly previously - starts to break because you changed one line.
Those are called regression bugs.
Bugs are part of our day to day as developers, but our job is to minimize them as much as possible.
Debugging is easy when you know how to deal with bugs.
How do you deal with bugs?
Well, first by trying to avoid them as much as possible, by carefully thinking about how your program should work, even before you write a single line of code.
Then, by analyzing every single line of code you wrote for possible issues or side effects or unconsidered things.
But things always slip under the radar. No one introduces bugs on purpose. Often times bugs only show up when the program is in production and used by the clients.
And.. once you know there’s a bug, how do you solve it?
Well, the hardest part is always identifying where the bug comes from.
Then the second hardest part is figuring out why this bug happens.
Solving the bug is generally easy once you know all of the above.
Generally we can do two things to solve the bug.
One technique is very basic and involves trying to figure out the values of the state (the content of the variables), and the flow of the program, and printing those variables to the logs, or to the output of your program.
Figuring out where the error could be
Debugging is one of those skills that’s core to the activity of a programmer.
Sometimes we do our best work, yet the program is not working correctly, for example, it’s crashing, it’s just slow or it’s printing wrong information.
What do you do when a program you wrote is not behaving like you expect?
You start debugging it.
The first step is always to look at what is happening, and trying to determine where the problem is coming from.
Is it a problem in the environment?
Is it a problem in the input you gave to the program?
Is it a one-time crash due to too much memory usage?
Or is it happening every time you run it?
Those are all key information to start going in the right direction when figuring out a problem.
Once you have some sort of idea where the error is coming from, you can start checking that specific part of code.
The simplest way to debug, at least in terms of tooling, is by reading the code you wrote. Aloud.
There is some magical thing in hearing from our own voice that does not happen when you read in silence.
Often times I found problems in this way.
After this step, it’s time to use some tools.
Your first contact with alert() and console.log()
If reading the code reveals nothing to you, the next logical step is to start adding a few lines into your code that can shed some light.
In JavaScript frontend code what you’ll often do is to use alert() and console.log .
Consider this line:
const a = calculateA()
const b = calculateB()
const result = a + b
For some reason we don’t know, the final result of the code is not correctly calculated, so we start by adding alert(a) and alert(b) before calculating the result.
The browser will open two alert panels when it executes the code:
const a = calculateA()
const b = calculateB()
alert(a)
alert(b)
const result = a + b
This works fine if what you are passing to alert() is a string or a number.
As soon as you have an array or an object things start to be too complicated for alert(), and you can use console.log():
const a = calculateA()
const b = calculateB()
console.log(a)
console.log(b)
const result = a + b
The value is printed in the JavaScript console of the browser developer tools.
Inspecting objects
Let’s say we have this object car, but we don’t know its content, and we want to inspect it:
const car = {
  color: "black",
  manufacturer: "Ford",
  model: "Fiesta",
}
We have several ways to do that.
console.log
console.log(car)

console.dir
console.dir(car)

In Node.js you can use the colors property to render colors in the terminal:
console.dir(car, { colors: true })

JSON.stringify()
This will print the object as a string representation:
JSON.stringify(car)

By adding these parameters:
JSON.stringify(car, null, 2)
you can make it print more nicely. The last number determines the amount of spaces in indentation:
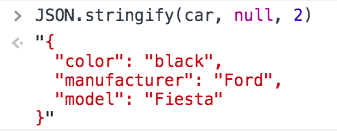
JSON.stringify() has the advantage of working outside of the console, as you can print the object on the screen as well.
Iterate the properties using a loop
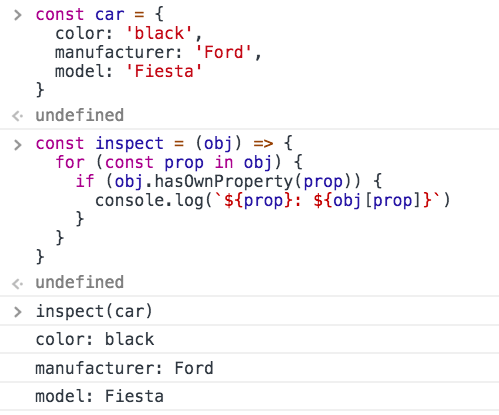
The for...in loop is handy to print all the properties of an object, used in this way:
const inspect = (obj) => {
  for (const prop in obj) {
    if (obj.hasOwnProperty(prop)) {
      console.log(`${prop}: ${obj[prop]}`)
    }
  }
}

inspect(car)
Using the browser debugger
It’s very important to be able to debug programs that don’t work as you expect.
One tool that helps you a lot when figuring out the source of bugs is to use the debugger.
The debugger is a tool that can be either be provided by your programming language compiler, or by the tooling that’s built around it.
For example the VS Code editor by Microsoft provides a JavaScript debugger.
Another debugger is provided inside the browser.
Using a debugger you will be able to stop the running of the program at any time you want, watch the content of the variables, execute any code you want, and step through the program execution one line of code at a time.
In the browser, adding the debugger statement to your code will pause the browser rendering the page and will start the debugger.
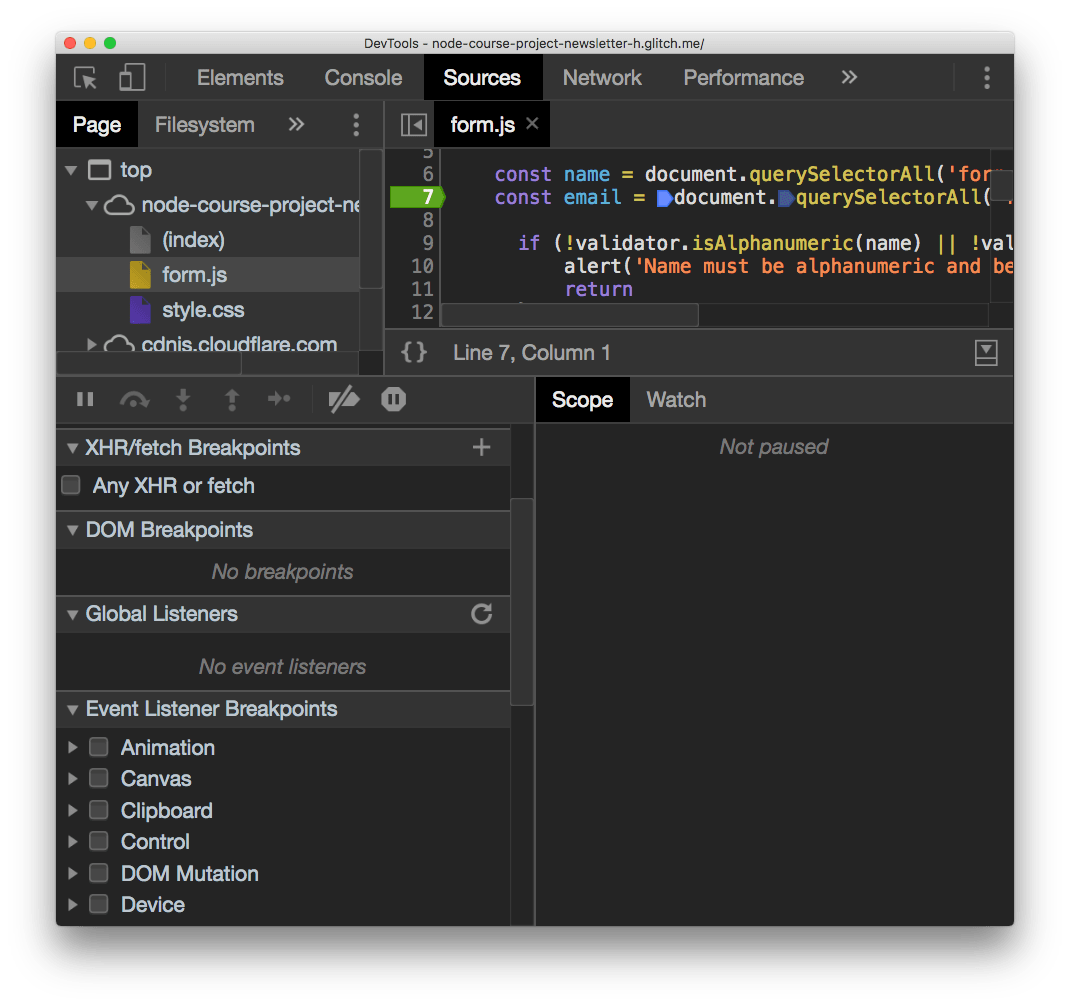
The debugger is the most powerful tool in the browser developer tools, and it’s found in the Sources panel:
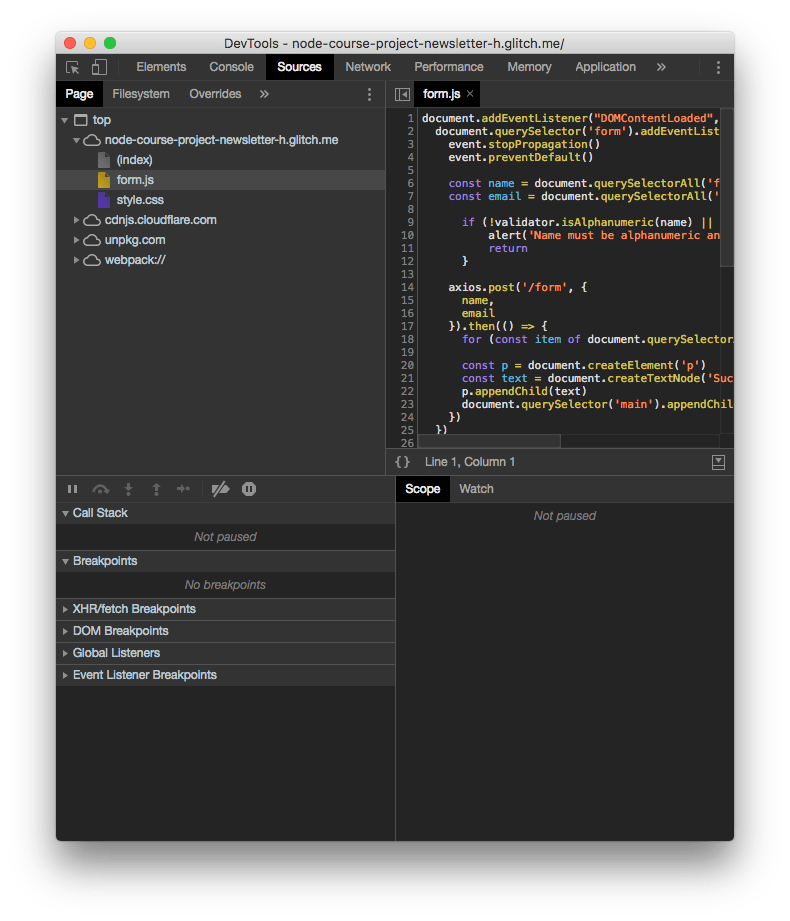
The top part of the screen shows the files navigator.
You can select any file and inspect it on the right. This is very important to set breakpoints, as we’ll see later.
The bottom part is the actual debugger.
Breakpoints
When the browser loads a page, the JavaScript code is executed until a breakpoint is met.
At this point the execution is halted and you can inspect all about your running program.
You can check the variables values, and resume the execution of the program one line at a time.
But first, what is a breakpoint? In its simple form, a breakpoint is a breakpoint instruction put in your code. When the browser meets it, it stops.
This is a good option while developing. Another option is to open the file in the Sources panel and click the number on the line you want to add a breakpoint:
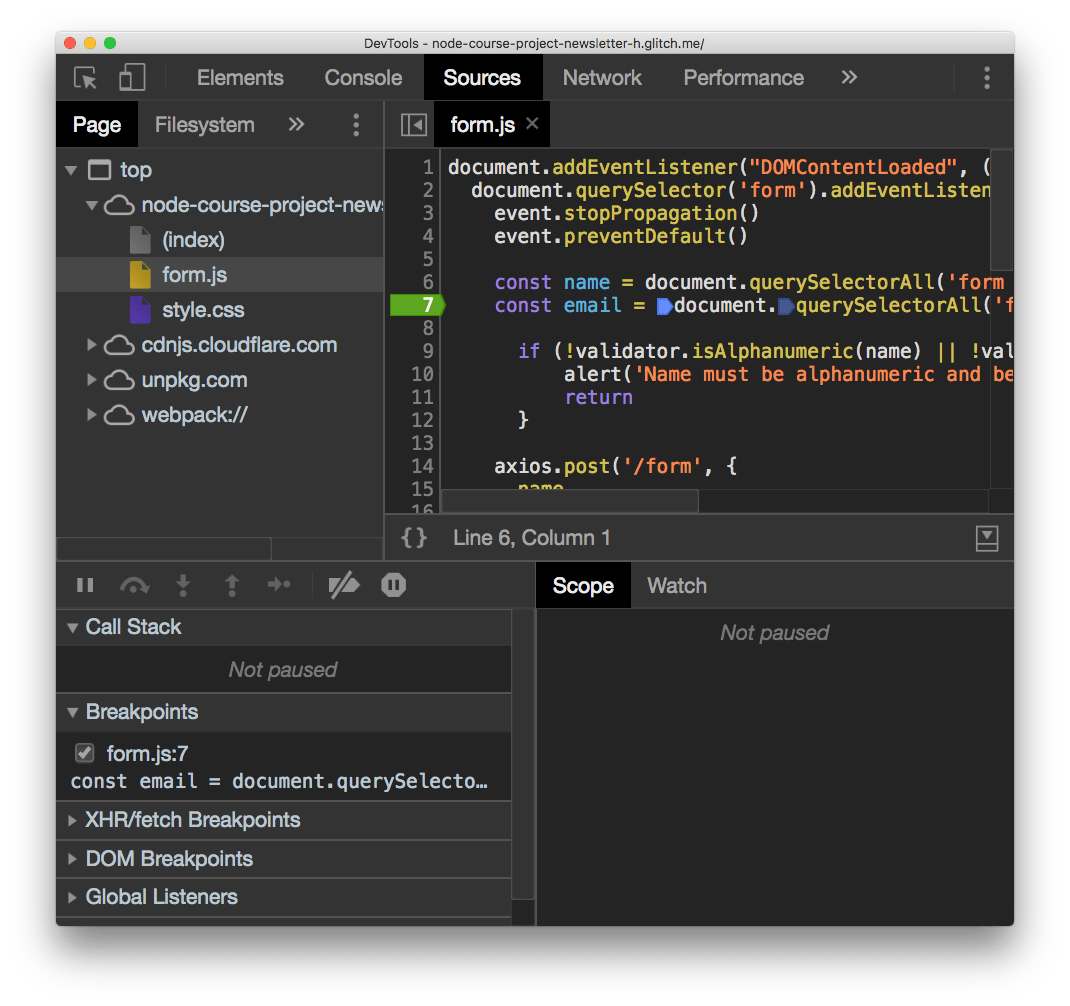
Clicking again the breakpoint will remove it.
After you add a breakpoint you can reload the page and the code will stop at that execution point when it finds the breakpoint.
As you add the breakpoint you can see in the Breakpoints panel that form.js on line 7 has the breakpoint. You can see all your breakpoints there, and disable them temporarily.
There are other types of breakpoints as well:
- XHR/fetch breakpoints: triggered when any network request is sent
- DOM breakpoints: triggered when a DOM element changes
- Event listener breakpoints: triggered when some event happens, like a mouse click
Scope
In this example I set a breakpoint inside an event listener, so I had to submit a form to trigger the it:
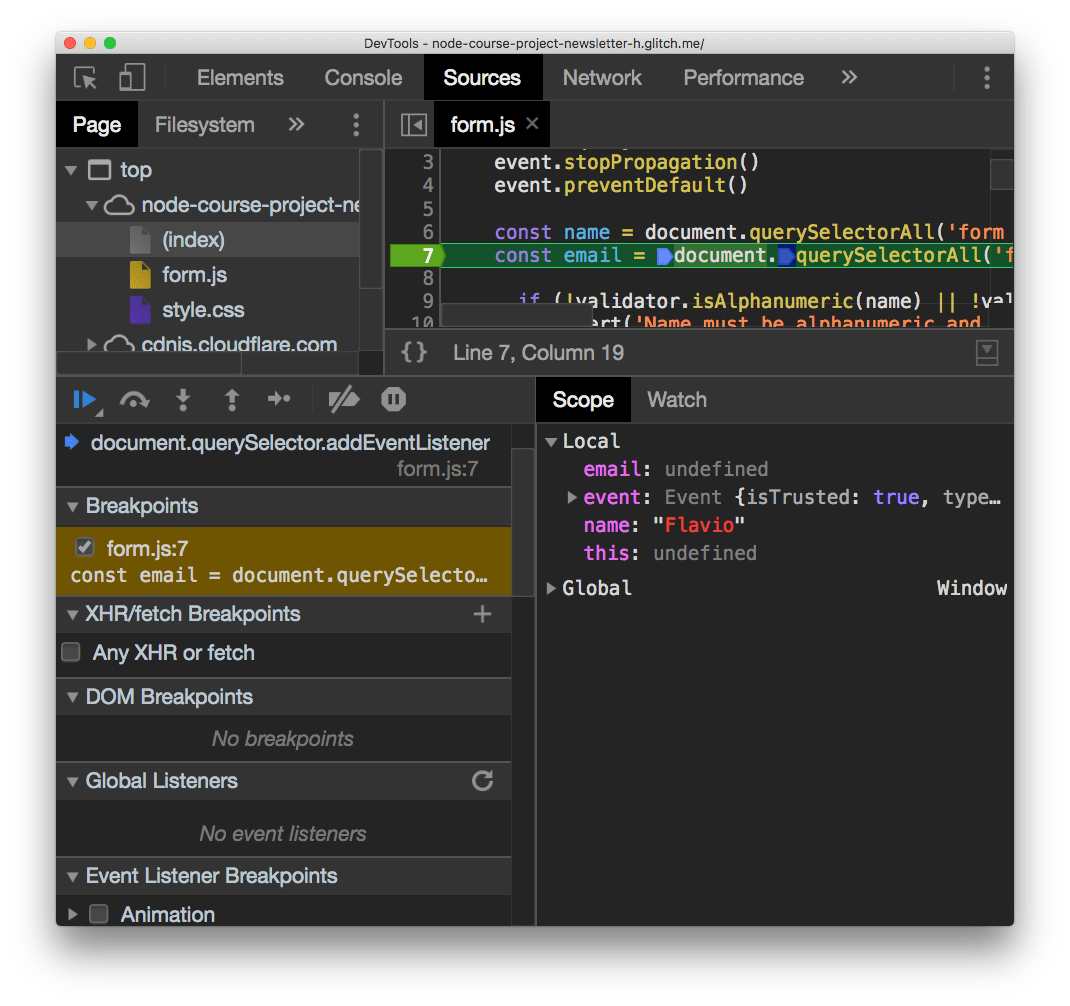
Now all the variables that are in the scope are printed, with their respective values. You can edit those variables by double clicking them.
Watch variables and expressions
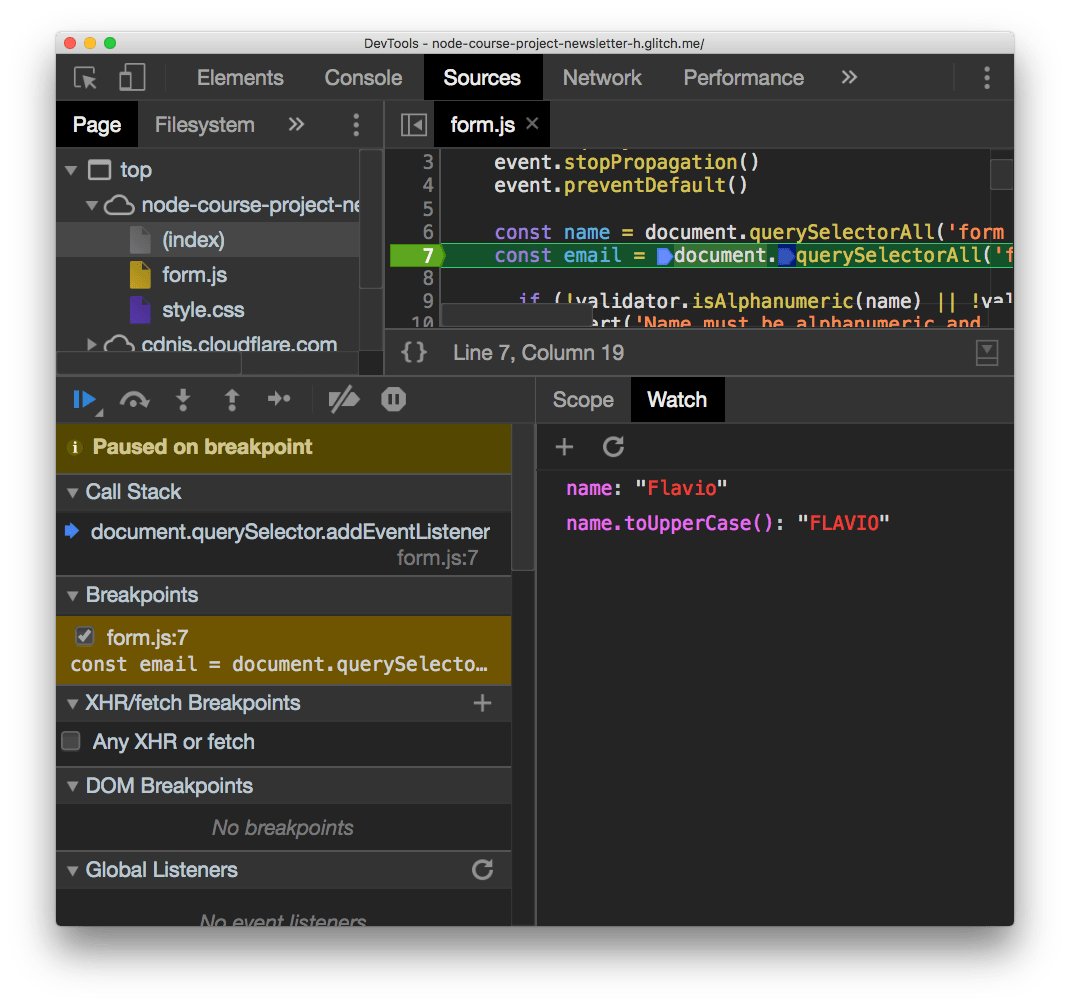
Right to the Scope panel there’s the Watch panel.
It has a + button which you can use to add any expression. For example adding name will print the name variable value, in the example Flavio. You can add name.toUpperCase() and it will print FLAVIO:
Resume the execution
Now the scripts are all halted since the breakpoint stopped the execution.
There is a set of buttons above the “Paused on breakpoint” banner that let you alter this state.
The first is in blue. Clicking it resumes the normal script execution.
The second button is step over, and it resumes execution until the next line, and stops again.
The next button perform a step into operation: goes into the function being executed, letting you go into the details of it.
Step out is the opposite: goes back to the outer function calling this one.
Those are the main ways to control the flow during debugging.
Edit scripts
From this devtools screen you can edit any script, also while the script is halted in its execution. Just edit the file and press cmd-S on Mac or ctrl-S on Windows/Linux.
Of course the changes are not persisted to disk unless you are working locally and set up workspaces in the devtools, a more advanced topic.
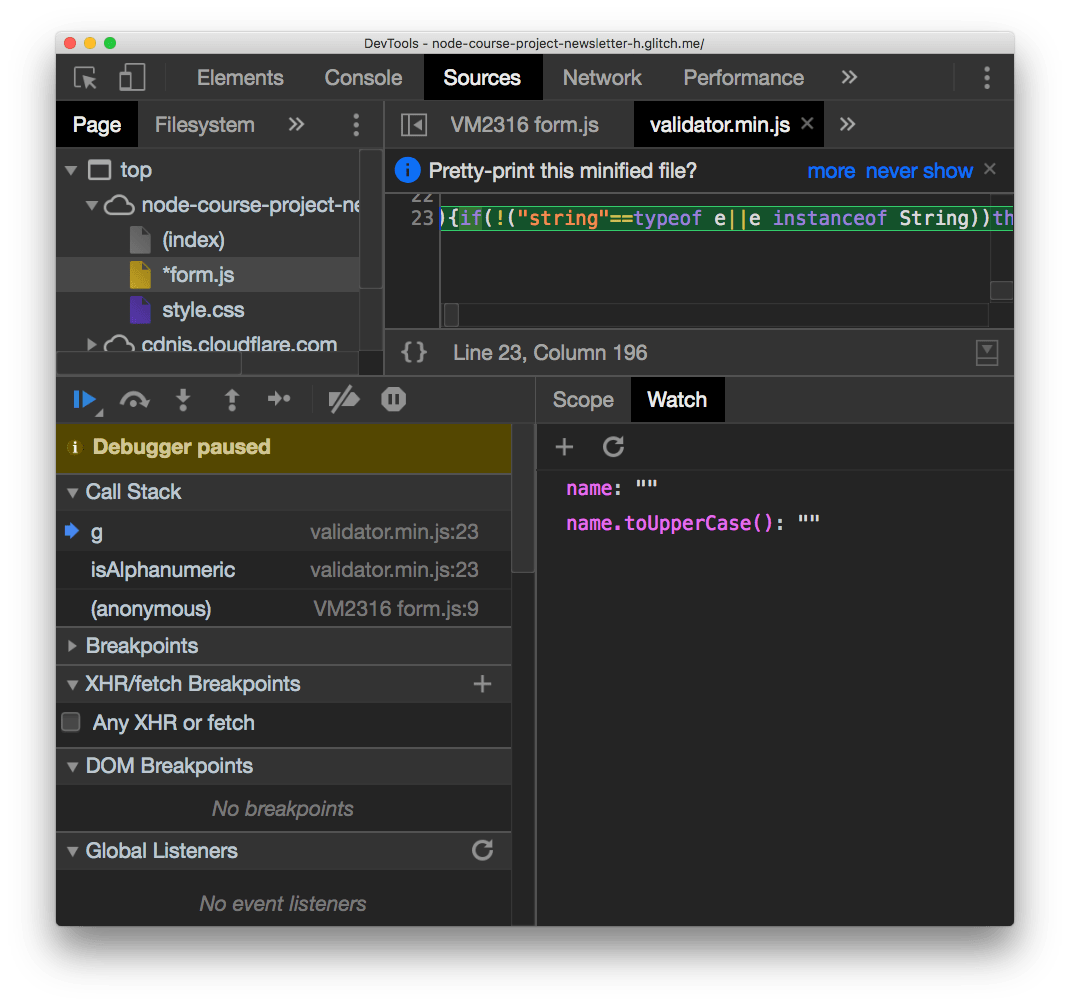
Inspect the call stack
The call stack is great to see how many functions levels you are deep into the JavaScript code. It lets you move up in the stack too by clicking each function name:
Print the stack trace
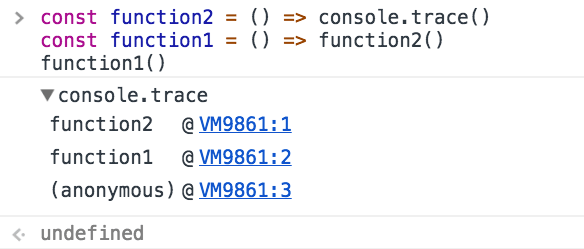
There might be cases where it’s useful to print the call stack trace of a function, maybe to answer the question how did you reach that part of code?
You can do so using console.trace():
const function2 = () => console.trace()
const function1 = () => function2()
function1()
Logging different error levels
As we saw previously, console.log is great for printing messages in the Console.
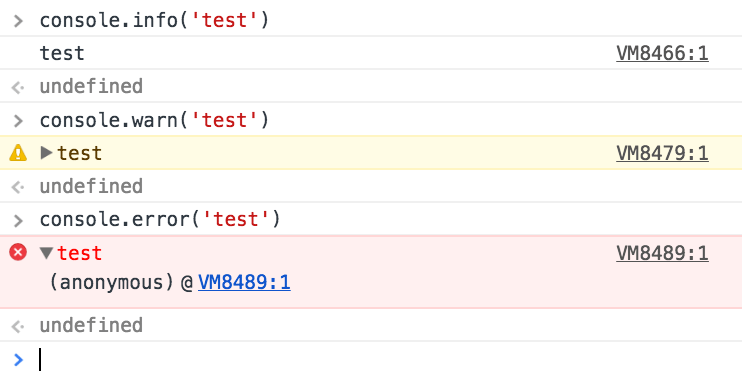
We’ll now discover three more handy methods that will help us debug, because they implicitly indicate various levels of error.
First, console.info()
As you can see a little ‘i’ is printed beside it, making it clear the log message is just an information.
Second, console.warn()
prints a yellow exclamation point.
If you activate the Console filtering toolbar, you can see that the Console allows you to filter messages based on the type, so it’s really convenient to differentiate messages because for example if we now click ‘Warnings’, all the printed messages that are not warnings will be hidden.
The third function is console.error()
this is a bit different than the others because in addition to printing a red X which clearly states there’s an error, we have the full stack trace of the function that generated the error, so we can go and try to fix it.
Preserve logs during navigation
Console messages are cleared on every page navigation, unless you check the Preserve log in the console settings:

Grouping console messages
The Console messages can grow in size and the noise when you’re trying to debug an error can be overwhelming.
To limit this problem the Console API offers a handy feature: Grouping the Console messages.
Let’s do an example first.
console.group('Testing the location')
console.log('Location hash', location.hash)
console.log('Location hostname', location.hostname)
console.log('Location protocol', location.protocol)
console.groupEnd()
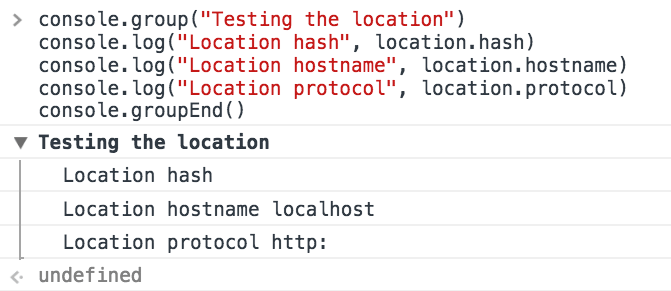
As you can see the Console creates a group, and there we have the Log messages.
You can do the same, but output a collapsed message that you can open on demand, to further limit the noise:
console.groupCollapsed('Testing the location')
console.log('Location hash', location.hash)
console.log('Location hostname', location.hostname)
console.log('Location protocol', location.protocol)
console.groupEnd()

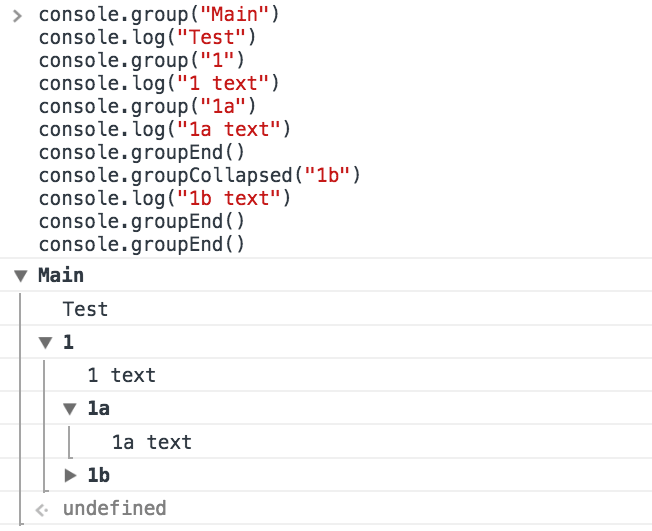
The nice thing is that those groups can be nested, so you can end up doing
console.group('Main')
console.log('Test')
console.group('1')
console.log('1 text')
console.group('1a')
console.log('1a text')
console.groupEnd()
console.groupCollapsed('1b')
console.log('1b text')
console.groupEnd()
console.groupEnd()
Blackbox scripts
Often times you work with libraries where you don’t want to “step into”, you trust them and you don’t want to see their code in the call stack, for example. Like in the above case for validator.min.js, which I use for email validation.
I trust it does a good job, so I can right-click it in the call stack and press Blackbox script. From then on, it’s impossible to step into this script code, and you happily work on just your own application code.
Use the browser devtools to debug Node.js
Since Node.js is built on the same engine of Chrome, v8, you can link the 2 and use the Chrome DevTools to inspect the execution of Node.js applications.
Open your terminal and run
node --inspect
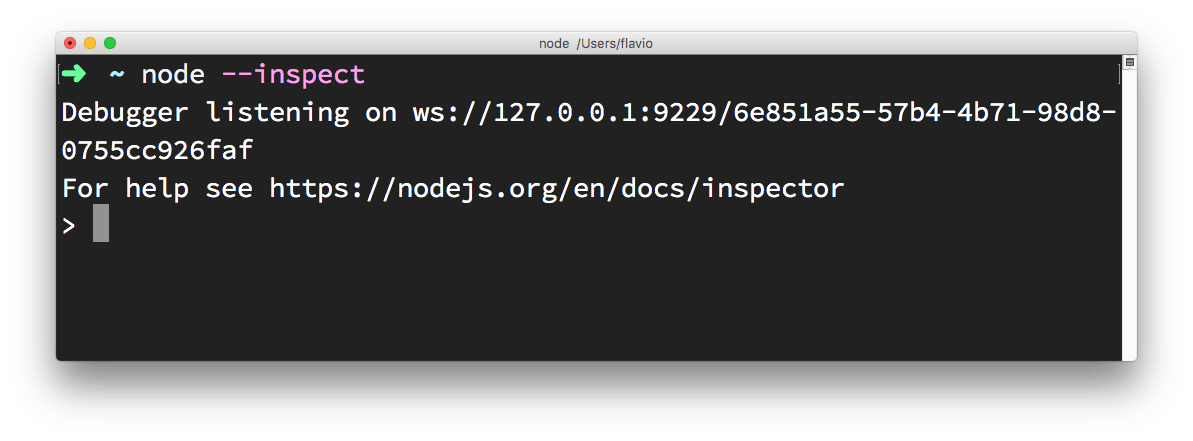
Then in Chrome type this URL: about://inspect.
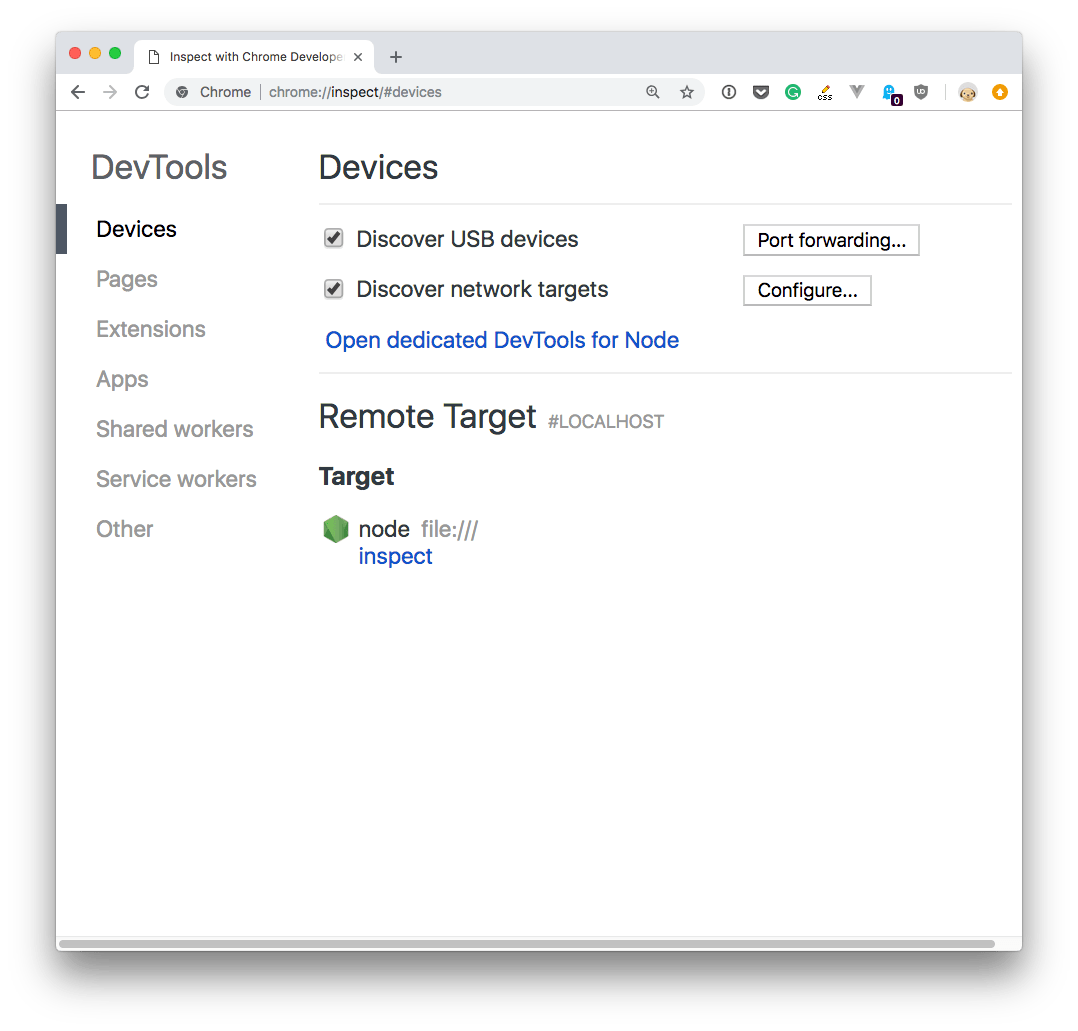
Click the Open dedicated DevTools for Node link next to the Node target, and you’ll have access to Node.js in the browser DevTools:
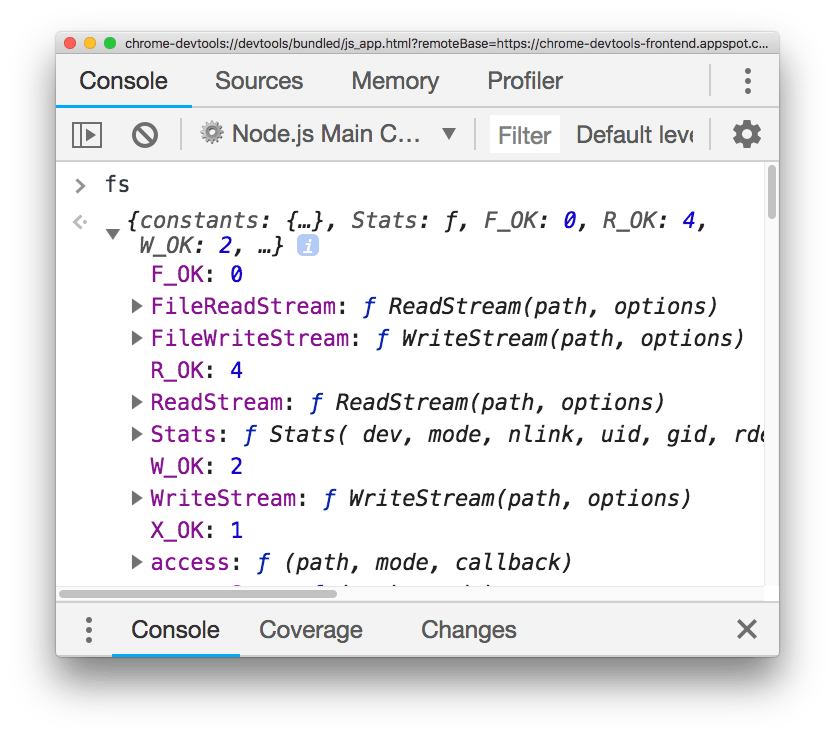
Make sure you click that, and not the inspect link down below, as it tool auto-reconnects to the Node.js instance when we restart it - pretty handy!
→ I wrote 17 books to help you become a better developer:
- C Handbook
- Command Line Handbook
- CSS Handbook
- Express Handbook
- Git Cheat Sheet
- Go Handbook
- HTML Handbook
- JS Handbook
- Laravel Handbook
- Next.js Handbook
- Node.js Handbook
- PHP Handbook
- Python Handbook
- React Handbook
- SQL Handbook
- Svelte Handbook
- Swift Handbook
Also, JOIN MY CODING BOOTCAMP, an amazing cohort course that will be a huge step up in your coding career - covering React, Next.js - next edition February 2025