Get a weekly report of your coding agents' work by project
By Flavio
Updated
Read a week of coding agent work per project in Work Tracebook, then build the same weekly report from its log with jq for a status update or an invoice.
On Friday someone asks what got done this week. A client wants a status update, or you want to know if the side project got any time at all. Your coding agents did most of the work, across four or five projects, and the chats where it happened are long gone.
Work Tracebook keeps that record. Each time an agent finishes something, it writes a one-line report with factorylog, and the app’s Week screen turns the reports into a weekly report: time per project, the days you worked, and every task that shipped.
By the end, you’ll know how to read that week, step back through earlier ones, and pull the same report out of the log in the terminal, ready to paste into an email. If your agents don’t report yet, Keep a timeline of what your coding agents did today covers the setup and the daily view. This one is about the week.
What you need
Work Tracebook runs on macOS 14 Sonoma or later, on Apple silicon and Intel. After buying, download the app zip from your Polar receipt, unzip it, and drag Work Tracebook to your Applications folder. The receipt also has the full source code.
Your agents need to be connected. The welcome screen installs factorylog in ~/.local/bin and adds standing instructions for Codex or a rule for Cursor. For any other agent, like Claude Code, use Another agent? Copy the instructions and paste them into its instructions file. A sandboxed agent also needs permission to write to ~/Library/Application Support/Factory Log.
The terminal part uses jq. On my Mac, running macOS 15 Sequoia, it’s already at /usr/bin/jq. If jq --version fails on yours, install it with Homebrew. If you’ve never used it, the jq command covers the basics.
Here’s the preflight check. Open a new Terminal window and run:
command -v factorylog/Users/flavio/.local/bin/factorylogIf it prints nothing, agents can’t find the command either, and your week will be empty. Fix the PATH first, as the docs explain.
The project names in this tutorial, like recipe-box and hostingpicker, are examples. So are the task titles and the times.
Open the week and read the header
A weekly report only works if it answers the three questions people ask first: how much, how many days, and compared to what. The Week screen puts those answers in one line at the top, before any chart. Without that line you’d be adding up seven daily views by hand, and you’d miss that Wednesday had no work at all. It also tells you which week you’re looking at, which matters more than it sounds once you start stepping back through older weeks and copying numbers into an email.
Press ⌘3. For the example week I use below, the header reads like this:
WEEK OF NOVEMBER 9
This week
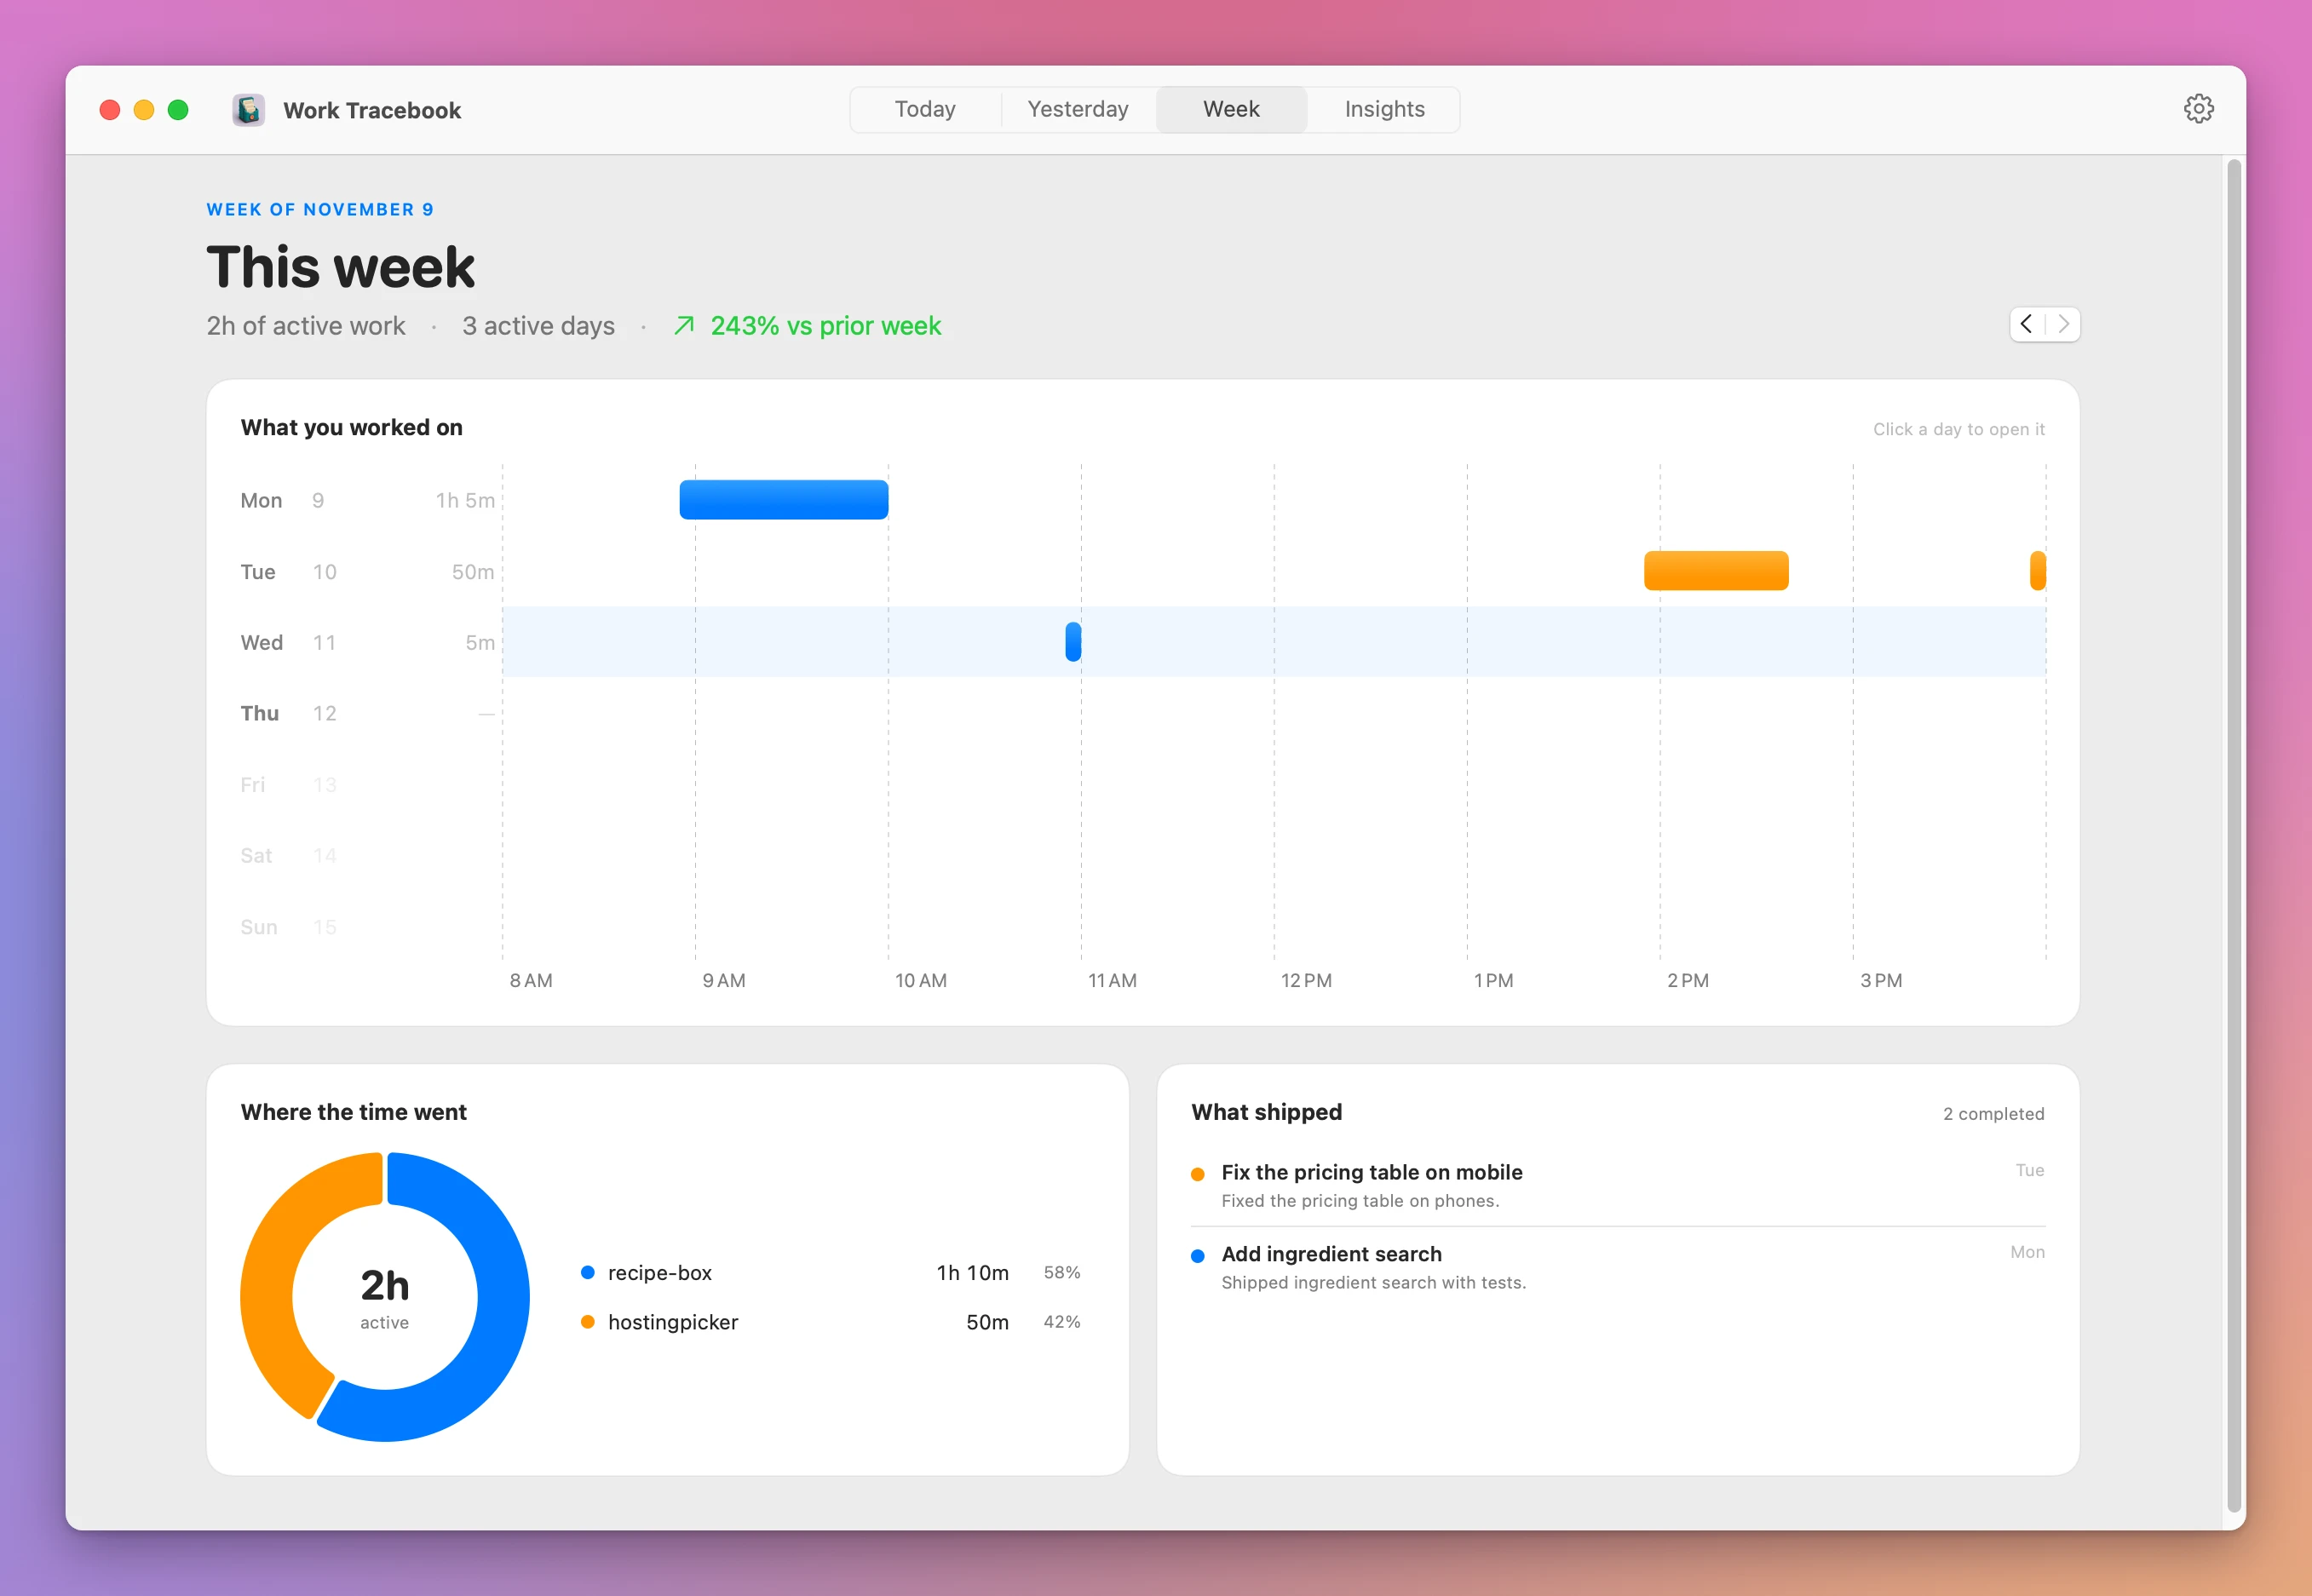
2h of active work · 3 active days · 243% vs prior week
The first line is the day the week starts. The title says This week, Last week, or a date range for older weeks. The last line has the active time, the number of days that had any, and the change against the week before.
The previous week had one 35-minute task, hence the big jump. The change only appears when the previous week has some time. On the first week you use the app, there’s nothing to compare against, so it’s left out. The arrow is green when you worked more and orange when you worked less.
Here’s the whole screen for the example week:
See where the time went, project by project
The header gives you one number, but a status update is per project. That’s what the two cards under the day chart are for. Where the time went splits the week’s active time between projects, as a donut and a list. What shipped lists the tasks agents finished, newest first. Together they’re the report: how long each project took, and what came out of it. Without the split, a big week on one client can hide the fact that another one got nothing.
The list next to the donut shows the six biggest projects with their time and their share. In the example week it has two rows:
Where the time went

● recipe-box        1h 10m   58%
● hostingpicker        50m   42%
With more than six projects, the rest are grouped into one row, like 3 more, with their combined time.
Click a project in that list and What shipped shows only its tasks. Click it again to see all of them. Each row has the task title, the agent’s final summary, and the weekday it finished:
What shipped                                  2 completed

● Fix the pricing table on mobile                     Tue
  Fixed the pricing table on phones.
● Add ingredient search                               Mon
  Shipped ingredient search with tests.
The card shows six tasks at first. With more, a Show all link with the total expands the list, and Show fewer collapses it again.
Example 1: a Friday status update for one client. Say hostingpicker is a client project. Press ⌘3, click hostingpicker under Where the time went, and read its time and share. What shipped now lists only hostingpicker’s tasks. Copy the titles and summaries into your update. That’s the whole report: hours from the list, outcomes from the shipped card, in under a minute.
The chart above both cards, What you worked on, has a row per day with each work session as a bar, colored by project. Click a day to open it in the day view, with its full timeline and every task.
Step back through earlier weeks
Monthly invoices and retrospectives need more than the current week. Sometimes you also need to check a claim, like when a feature shipped or which week a client project went quiet. The day views only go back one day at a time, and paging through seven days per week gets old fast. Stepping through weeks gives you the same report for any past week, built from the same log.
The two arrow buttons next to the header, or the left and right arrow keys, move one week at a time. When you’re not on the current week, a This Week button brings you back.
The left arrow stops at the week of the oldest report in your log. The right arrow stops at the current week, since there’s nothing to show for next week.
Moving to another week clears the project you clicked, so What shipped goes back to every project. Click it again in the new week if you’re following one client.
If a week has no reports, both cards say:
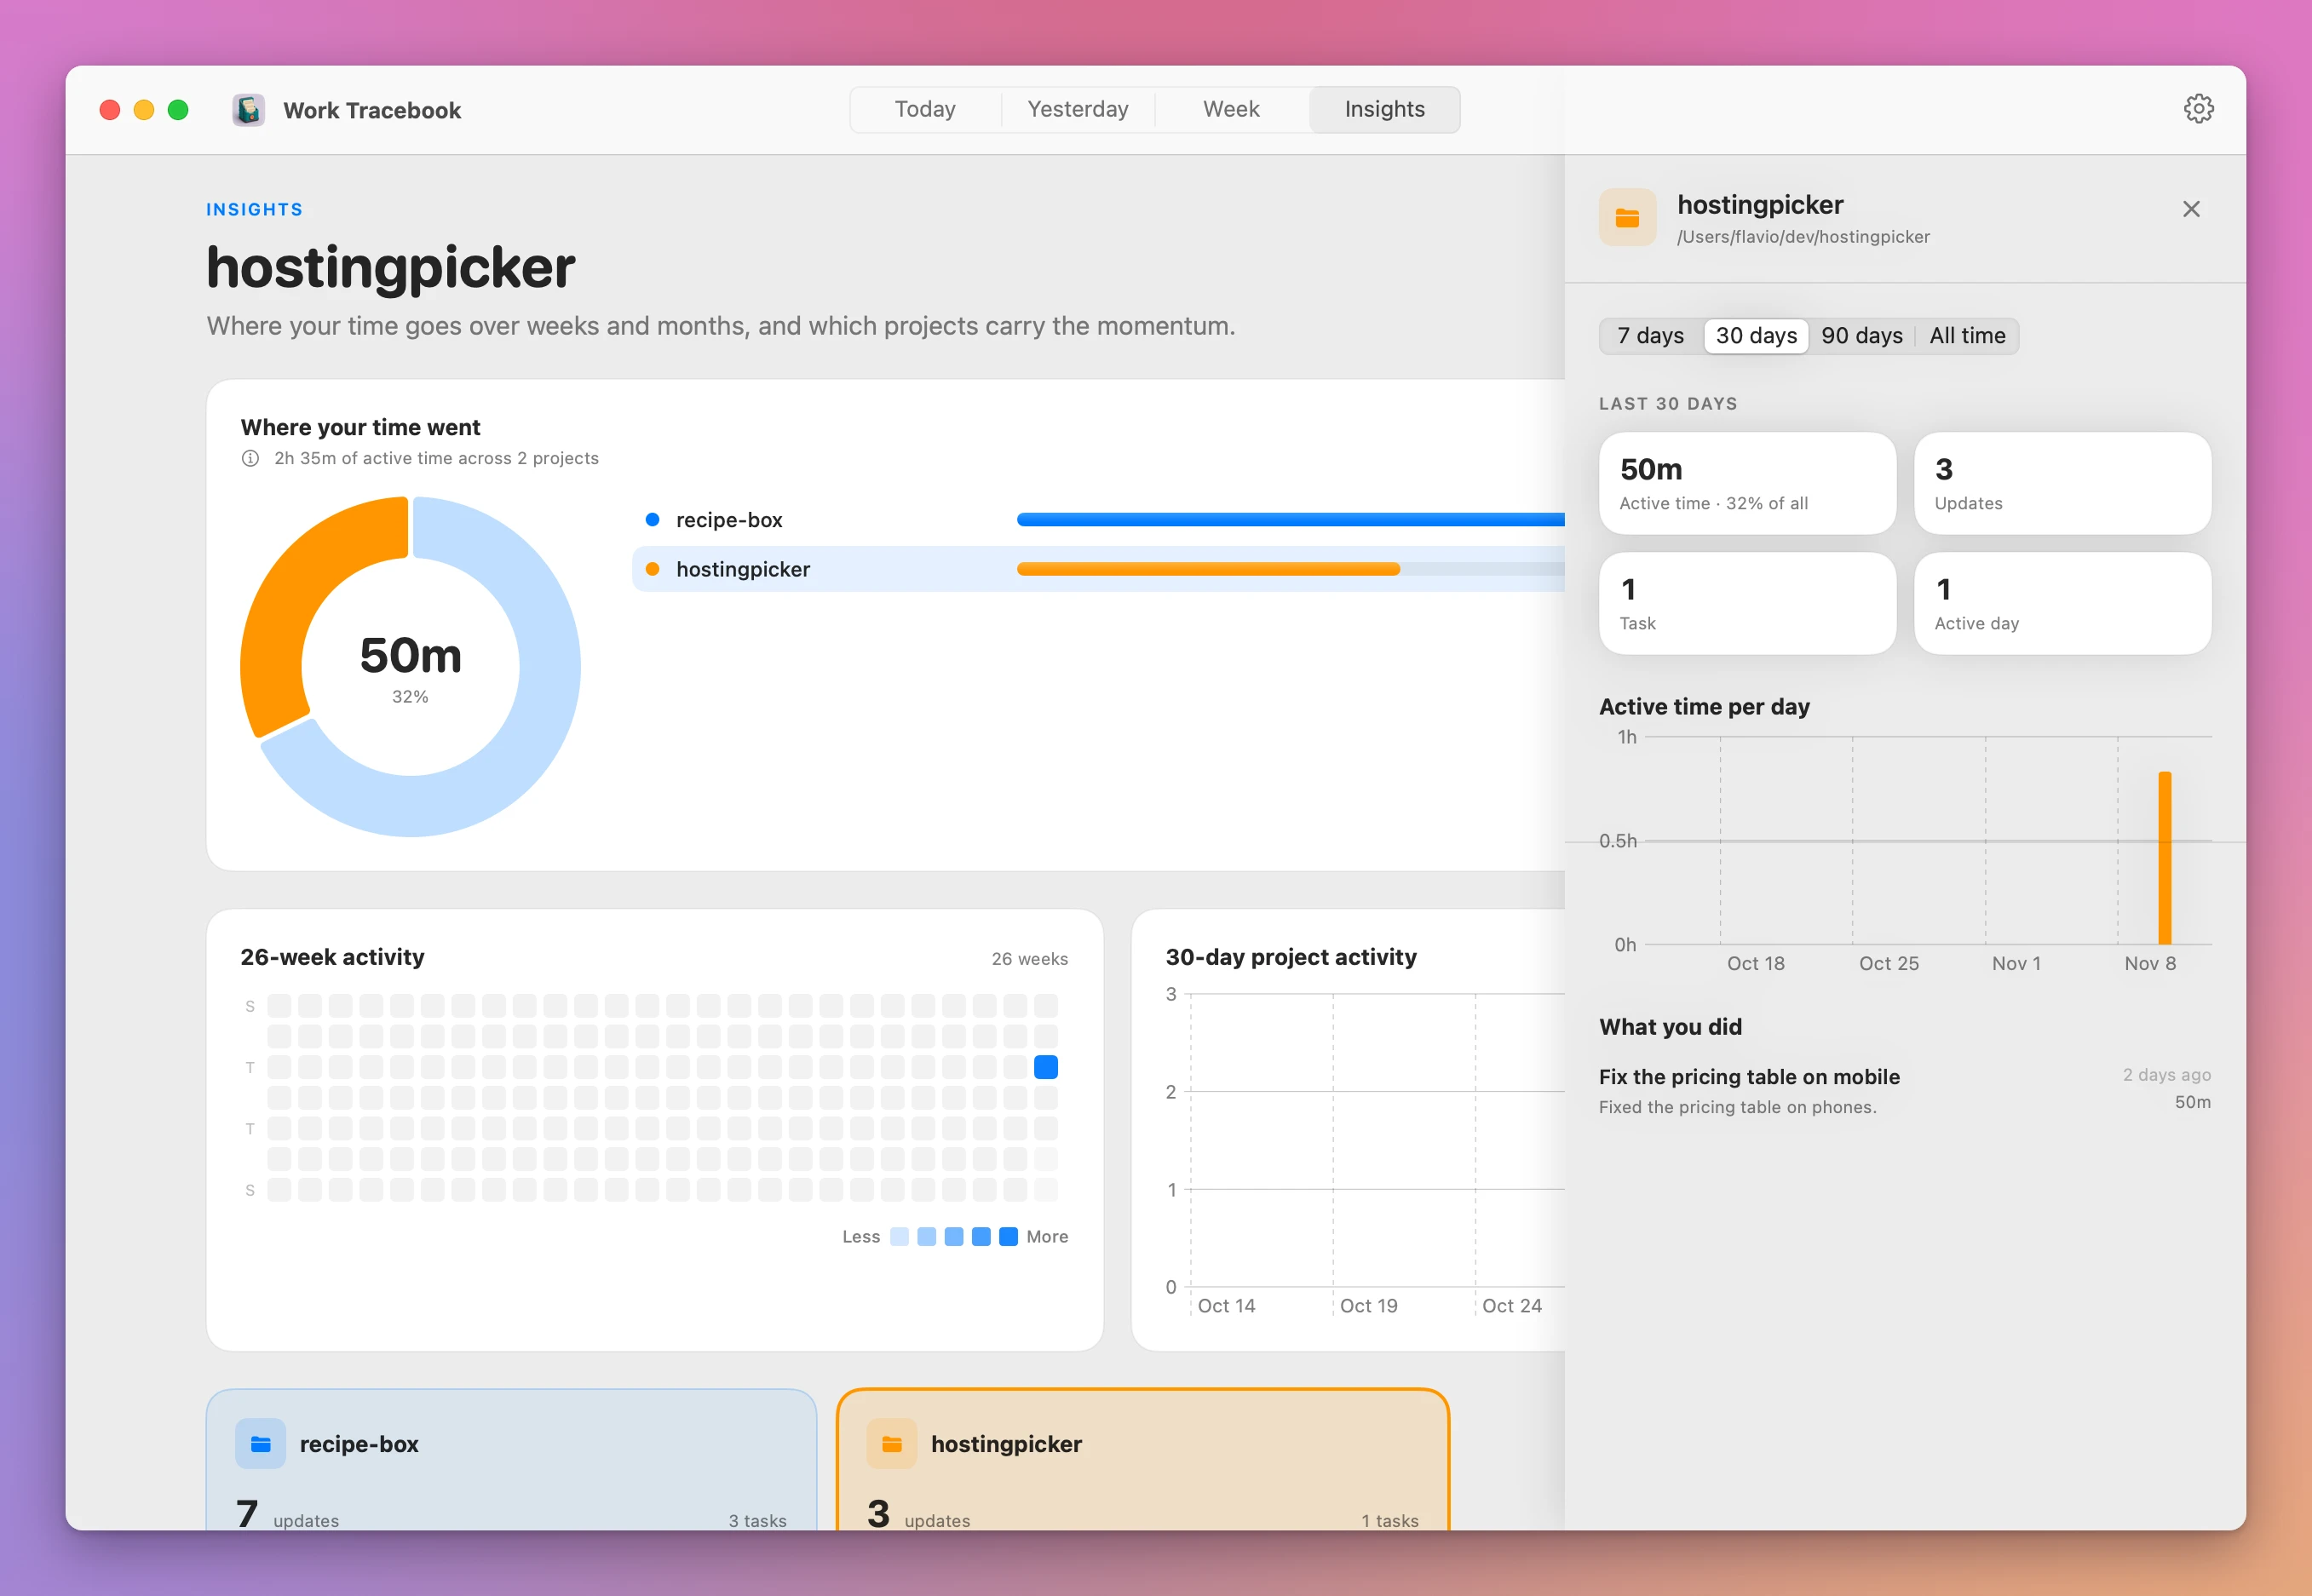
No agent activity this week.Insights, on ⌘4, is the next step up. It has time by project over 7, 30 or 90 days, or all time, a 26-week heatmap, and the busiest projects. Click a project to open a panel with its time, its daily rhythm and every task you did there. For a monthly invoice, the 30-day view of one project is usually the right number.
This is the hostingpicker panel in the example log, on the 30-day view:
Know what the week’s numbers count
Before you send a weekly report to someone, you should know where each number comes from. Agents report outcomes, not hours, so the time is an estimate built from when reports arrive. The week boundaries, the time rule and the shipped list each have a rule. If you don’t know them, a task an agent forgot to close will look like missing work, and a busy Sunday night can land in the wrong week. Here’s how the app counts, from its source.
The week follows your Mac’s calendar, so whether it starts on Monday or Sunday depends on your region settings. Within a project, reports at most 45 minutes apart count as one session, and the first report of a session gets 5 minutes for the work before it. Each project is measured on its own, so two agents working on two projects at the same time add time to both.
What shipped only lists tasks an agent closed with factorylog archive, or that you closed in the app. A task still open after 24 hours gets closed by the app, with the summary “Automatically marked Done 24 hours after the task started.” That automatic close doesn’t count as shipped and adds no time.
Example 2: why a project has less time than you expected. In my example week, hostingpicker had reports at 14:00, 14:40 and 16:00 on Tuesday. The first gets 5 minutes. The second comes 40 minutes later, inside the 45-minute gap, so it adds 40. The third comes 80 minutes later, so it starts a new session and gets 5. That’s 50 minutes, not the two hours on the clock, and it’s why Tuesday has two hostingpicker bars in the screenshot above, a long one around 14:00 and a short one just before 16:00. If an agent worked quietly for an hour without reporting, the app can’t see it.
Build the same report in the terminal
The app is great to look at, but a report you send is text. Every report is one line of JSON in ~/Library/Application Support/Factory Log/events.jsonl, and lines are only ever added. That makes the log easy to query with jq. You get a list you can paste into an email or an invoice, and it includes hidden projects, since hiding is only a display setting. You also learn what the log holds, which helps when a number in the app looks wrong.
Try it on a scratch log first, so nothing shows up in your real timeline. --store writes to another file, --project-path sets the project, and --timestamp backdates a report:
log=/tmp/tracebook-week/events.jsonl
mkdir -p /tmp/tracebook-week
task=$(factorylog start --title "Add ingredient search" --summary "Started search by ingredient name." --source codex --project-path /Users/flavio/dev/recipe-box --store $log --timestamp 2026-11-09T09:00:00+01:00 | jq -r .event.taskID)
factorylog report --task-id $task --summary "Search now matches partial ingredient names." --store $log --timestamp 2026-11-09T09:30:00+01:00
factorylog archive --task-id $task --summary "Shipped ingredient search with tests." --store $log --timestamp 2026-11-09T10:00:00+01:00
Each command prints one line of JSON. I added two more tasks the same way, one in hostingpicker and one in recipe-box that’s still open. Here’s what a line in the log looks like:
{"id":"2aefbd8e-3648-4fcd-84a5-1aefecb29e43","kind":"task.started","project":{"name":"recipe-box","path":"\/Users\/flavio\/dev\/recipe-box"},"schemaVersion":1,"source":{"tool":"codex"},"summary":"Started search by ingredient name.","taskID":"task_3ac84c6299c8477b95c326d88ba18e95","taskTitle":"Add ingredient search","timestamp":"2026-11-09T08:00:00Z"}Notice the timestamp: 09:00 in Rome is stored as 08:00 in UTC. Every query below compares those UTC strings, so a week from 2026-11-09 to 2026-11-16 starts at 01:00 Rome time. For a weekly report that’s close enough, but it’s why the terminal and the app can disagree by a report near midnight.
First, what shipped this week, one line per task:
jq -r 'select(.timestamp >= "2026-11-09" and .timestamp < "2026-11-16" and .kind == "task.archived") | "\(.project.name): \(.taskTitle) — \(.summary)"' $logrecipe-box: Add ingredient search — Shipped ingredient search with tests.
hostingpicker: Fix the pricing table on mobile — Fixed the pricing table on phones.Then the counts per project. -s reads the whole log into one array, so you can group it:
jq -s 'map(select(.timestamp >= "2026-11-09" and .timestamp < "2026-11-16")) | group_by(.project.path) | map({project: .[0].project.name, updates: length, tasks: (map(.taskID) | unique | length), shipped: (map(select(.kind == "task.archived")) | length)})' $log[
{
"project": "hostingpicker",
"updates": 3,
"tasks": 1,
"shipped": 1
},
{
"project": "recipe-box",
"updates": 4,
"tasks": 2,
"shipped": 1
}
]The estimated time, with the same 45-minute and 5-minute rule the app uses, skipping automatic archives:
jq -rs 'map(select(.timestamp >= "2026-11-09" and .timestamp < "2026-11-16" and .summary != "Automatically marked Done 24 hours after the task started.")) | group_by(.project.path)[] | {name: .[0].project.name, minutes: ([.[].timestamp | fromdateiso8601] | sort | reduce .[] as $t ({prev: null, sum: 0}; .sum += (if .prev != null and ($t - .prev) <= 2700 then $t - .prev else 300 end) | .prev = $t) | .sum / 60)} | "\(.name)\t\(.minutes) min"' $loghostingpicker 50 min
recipe-box 70 minThese are the numbers in Where the time went on the Week screen, 1h 10m and 50m, so if you’d rather click, ⌘3 gives you the same split. hostingpicker matches Example 2. recipe-box is 5 + 30 + 30 for Monday’s task, plus 5 for the task started on Wednesday. The app counts every session across your whole history, so a session that crosses midnight at the start of the week can make its number differ by a few minutes from this one.
And the tasks still open, which are worth a look before you send anything:
jq -rs 'map(select(.timestamp >= "2026-11-09" and .timestamp < "2026-11-16")) | group_by(.taskID) | map(select(all(.kind != "task.archived"))) | .[] | "\(.[0].project.name): \(.[0].taskTitle) (still Doing)"' $logrecipe-box: Write the import docs (still Doing)To run these on your real history, point log at the real file. The folder name has a space, so keep the quotes:
log="$HOME/Library/Application Support/Factory Log/events.jsonl"Example 3: the path without quotes. Type the path straight into the command without quotes, and jq gets three arguments instead of one:
jq: error: Could not open file Application: No such file or directory
jq: error: Could not open file Support/Factory: No such file or directory
jq: error: Could not open file Log/events.jsonl: No such file or directory
Wrap the path in double quotes, or use the log variable above, and it works.
The queries only read the log, so you can run them as often as you want. When you’re done with the scratch log, rm -r /tmp/tracebook-week removes it. It never touched the real one.
Turn it into a Friday habit
A weekly report is only useful if it happens every week. Skip two Fridays and you’re back to reconstructing a fortnight from memory, which is the problem we started with. The record is still there, since the log keeps everything, but the habit is what turns it into an update someone receives. Pick the format that matches who reads it.
The easy version: every Friday, press ⌘3, click each client project, and copy what shipped. If you prefer text, save the queries above in a script that takes the start and end dates, and run it at the end of the week.
You can also hand the output to a coding agent. Paste the shipped list and the per-project minutes, and ask it for a three-line status update per project. The reports are already the agents’ own words, so the update mostly needs trimming. Keep in mind the time is an estimate of activity, not a timesheet. If you bill by the hour, say so to your client, or use it as a sanity check next to your own tracking.
Two settings change what the week shows. Right-click a project and choose Hide Project to keep it out of every view; Settings → Hidden projects has a Show button to bring it back, and its history stays in the log. Work an agent does in its own folder, like ~/.codex, ~/.cursor, ~/.claude or ~/.agents, never shows up at all.
The other is Settings → History & storage. Purging old detailed history is destructive: it asks “Purge old detailed history?” before it removes anything. The daily and project totals stay, and so do the start and final outcome of every finished task. The app’s weekly time and shipped list survive, but the terminal queries for those weeks see fewer reports, so their counts and minutes go down. Nothing is removed automatically.
If something looks wrong
- If the week says “No agent activity this week.” while agents worked, run
command -v factorylogin a new Terminal window. If it prints nothing, add~/.local/binto yourPATHand restart the agent. - If Send a test report shows up but agent reports don’t, start a new agent session. A session that was open before you connected the agent hasn’t read the instructions.
- If Codex never reports, its sandbox can’t write the log. Add the log folder to
writable_rootsunder[sandbox_workspace_write]in~/.codex/config.toml. - If a task you know is done isn’t in What shipped, the agent never archived it. If it was closed 24 hours later with “Automatically marked Done 24 hours after the task started.”, the app closed it, and that close doesn’t count as shipped.
- If a project is missing from Where the time went, check Settings → Hidden projects. Projects in an agent’s own folder never show up.
- If jq says
Could not open file Application: No such file or directory, the path has a space and no quotes. Quote it, as in Example 3. - If the terminal minutes differ from the app by a few, look for reports near midnight UTC or a session that started late the previous Sunday. The queries cut the week in UTC; the app uses your Mac’s calendar.
- If the week starts on the wrong day, the app follows your Mac’s region settings for the first day of the week.
Get Work Tracebook
Turn coding agents’ one-line reports into daily timelines, weekly views, and time estimates for every project on your Mac.
See Work Tracebook → · Read the docs · $20 including tax, with full source code.
Want me to talk about your product? You can sponsor this site.