
A developer tool by Flavio
Port Pilot
See which local server is on which port, which project started it, and if it answers. Stop the right process from a terminal dashboard, CLI or menu bar.
Buy Port Pilot · $20One-time purchase. Tax included. Source code included.
macOS and Linux CLI · macOS 13 or later companion
Latest version 1.2.0, released November 20, 2026
Port 3000 is busy, again
You run npm run dev and get EADDRINUSE: address already in use :::3000. Something is on that port. Is it yesterday’s Next.js server in a terminal tab you closed? A Docker container? Another project entirely?
I built Port Pilot because a busy port always sent me on the same scavenger hunt.
Which process is using port 3000?
Which project does it belong to?
Is it still doing something useful, or can I stop it?
The answer was usually spread across lsof, ps, Docker, browser tabs, and a few carefully typed kill commands.
Port Pilot puts that information in one place. It shows every local service on your computer, which project and command started it, and whether it answers over HTTP. You can use it from a native macOS menu bar app, an interactive terminal dashboard, or the command line.
Here’s a one-minute look at the terminal dashboard and the ports command, with six local dev servers running:
The projects and servers in the video are fictional.
Who it’s for
- Developers juggling several projects. You have an Astro site, a Next.js app and a Vite admin open, plus a worker you started last week. Port Pilot lists them by project name with their URLs, so you open the right one instead of guessing between 3000, 4321 and 5173.
- Anyone who hits
EADDRINUSE. Runports check 3000and see the PID, the project folder, the command and the process chain, before you decide what to stop. The walkthrough is in Fix “EADDRINUSE: address already in use” on a local port. - Docker users. A port is taken and no local process seems to own it. Port Pilot shows the container name, image and private port behind a published port. More in See which Docker container published a local port.
- People running coding agents. An agent starts servers and forgets them.
ports list --jsonandports wait 4321 --http 200give it real answers and exit codes instead of a colored table to scrape. - Developers writing test scripts. End-to-end tests start before the server is ready and fail.
ports waitblocks until the server returns the HTTP status you expect, with a timeout. See Wait until a local server is ready before running tests.
Start with the dashboard
Run this command:
portsPort Pilot opens a live terminal dashboard. It shows the port, project, framework, process, owner, memory use, uptime, command and process ancestry.
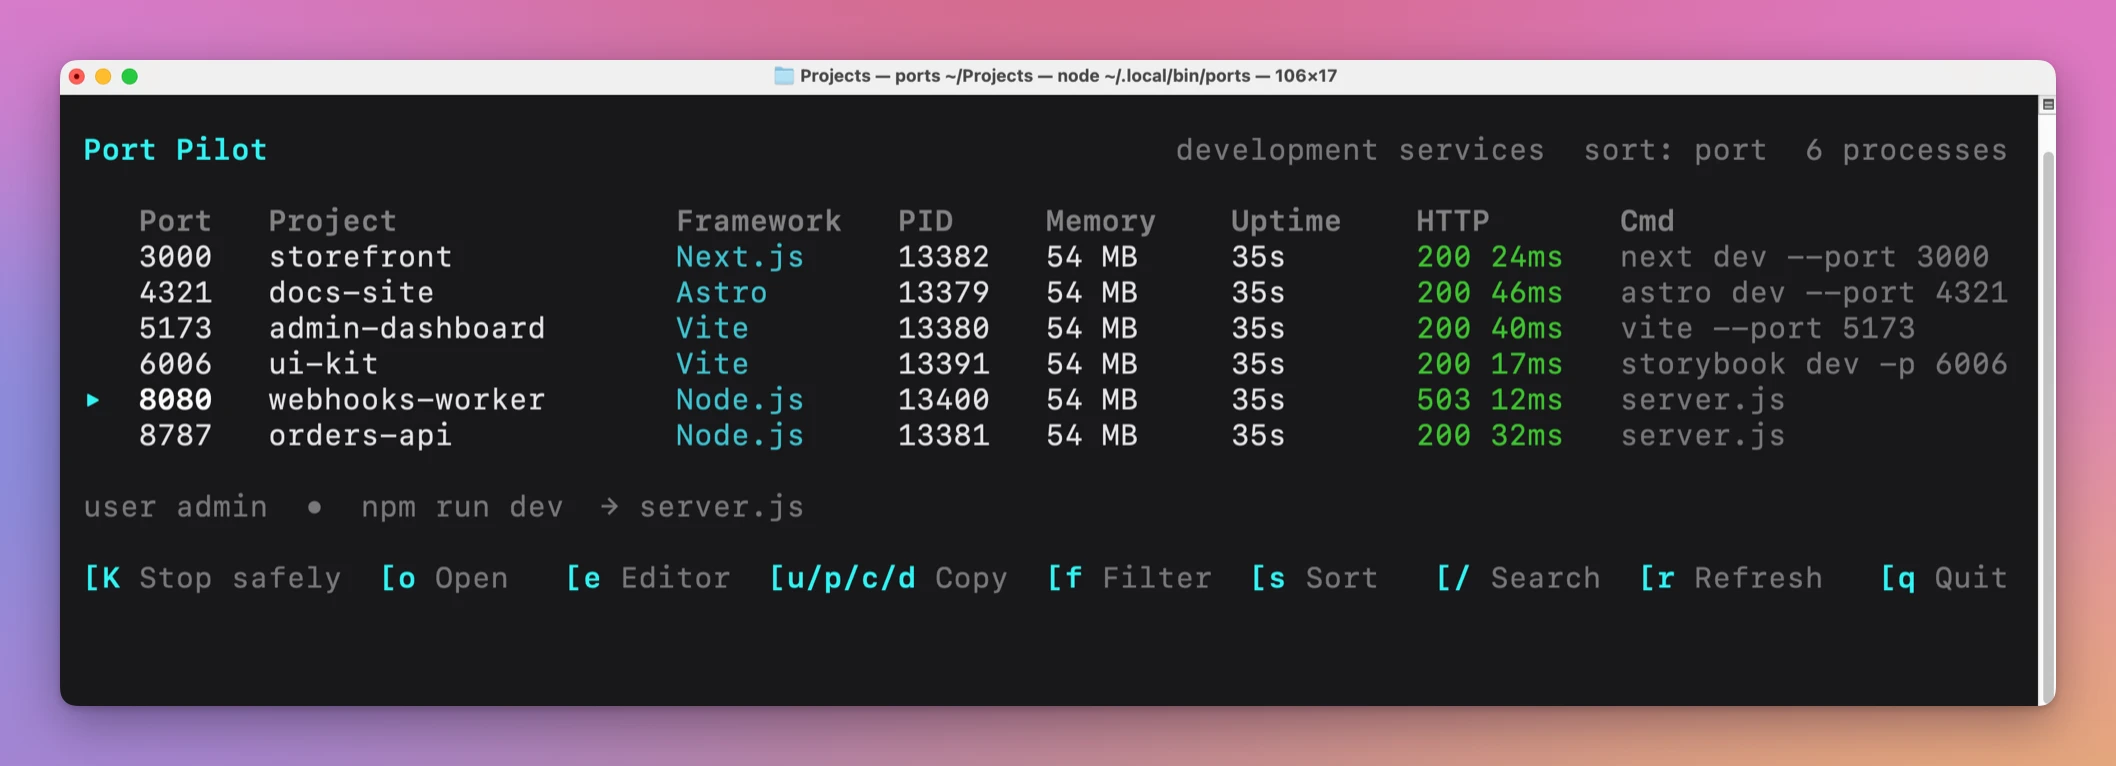
For web services, it can also show the local URL, HTTP status, page title and response time. If Docker published the port, Port Pilot adds the container name, image and private port.
The default view focuses on development services: listeners with a project, framework, runtime or Docker mapping behind them. You can switch to all listeners when you need to inspect system processes or something Port Pilot could not identify.
You can search, sort, copy a URL, open the service in a browser, open its project in your editor, or inspect more details without leaving the dashboard. Every action has a single key:
| Key | Action |
|---|---|
Up/Down or j/k | Select a service |
/ | Search |
f and s | Cycle filters and sorting |
o | Open its local URL |
e | Open the project directory |
u, p, c, d | Copy URL, port, command or directory |
K | Preview stopping the process tree |
A native macOS companion
I also built a native SwiftUI menu bar app. It gives you a compact list of local services without keeping another terminal window open.
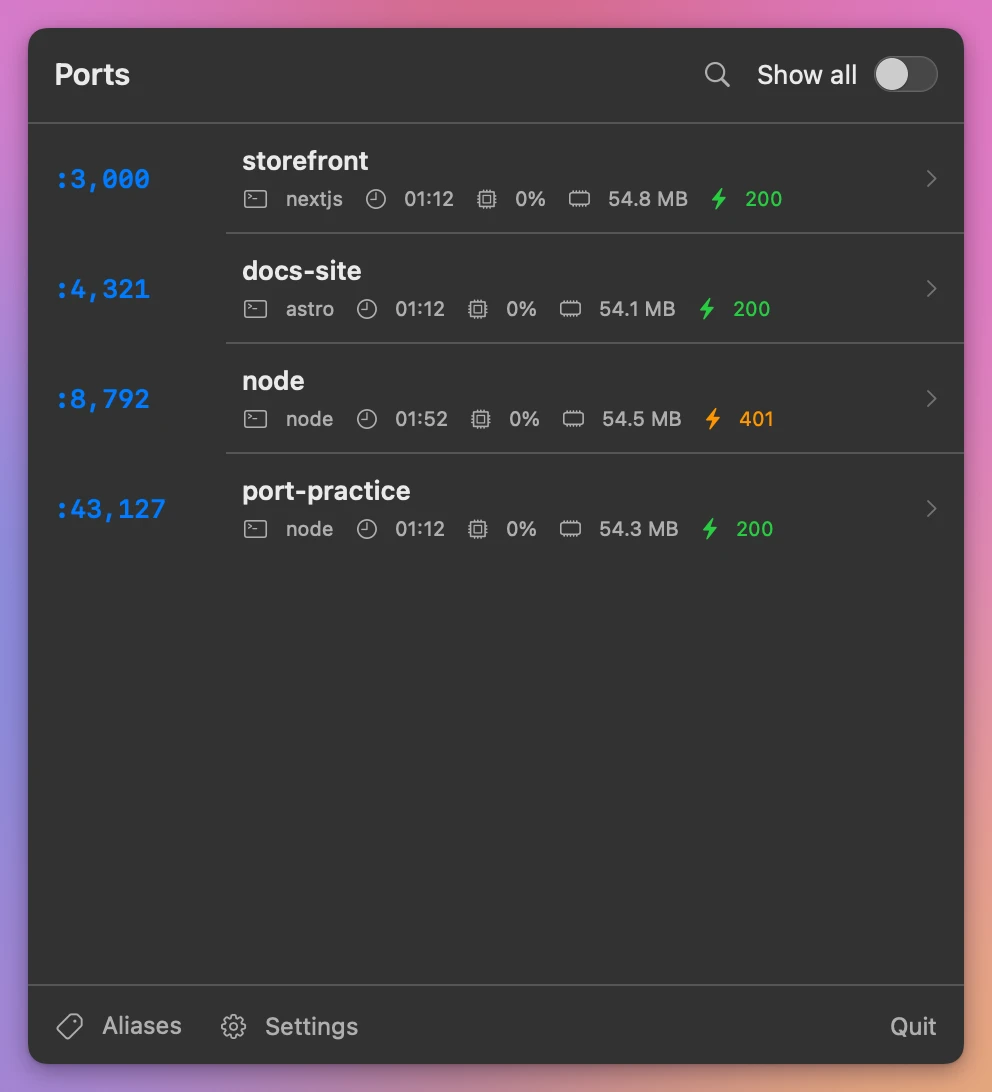
Click a service to see what is running, check its health, open the project, copy its URL, create an alias, or stop it.
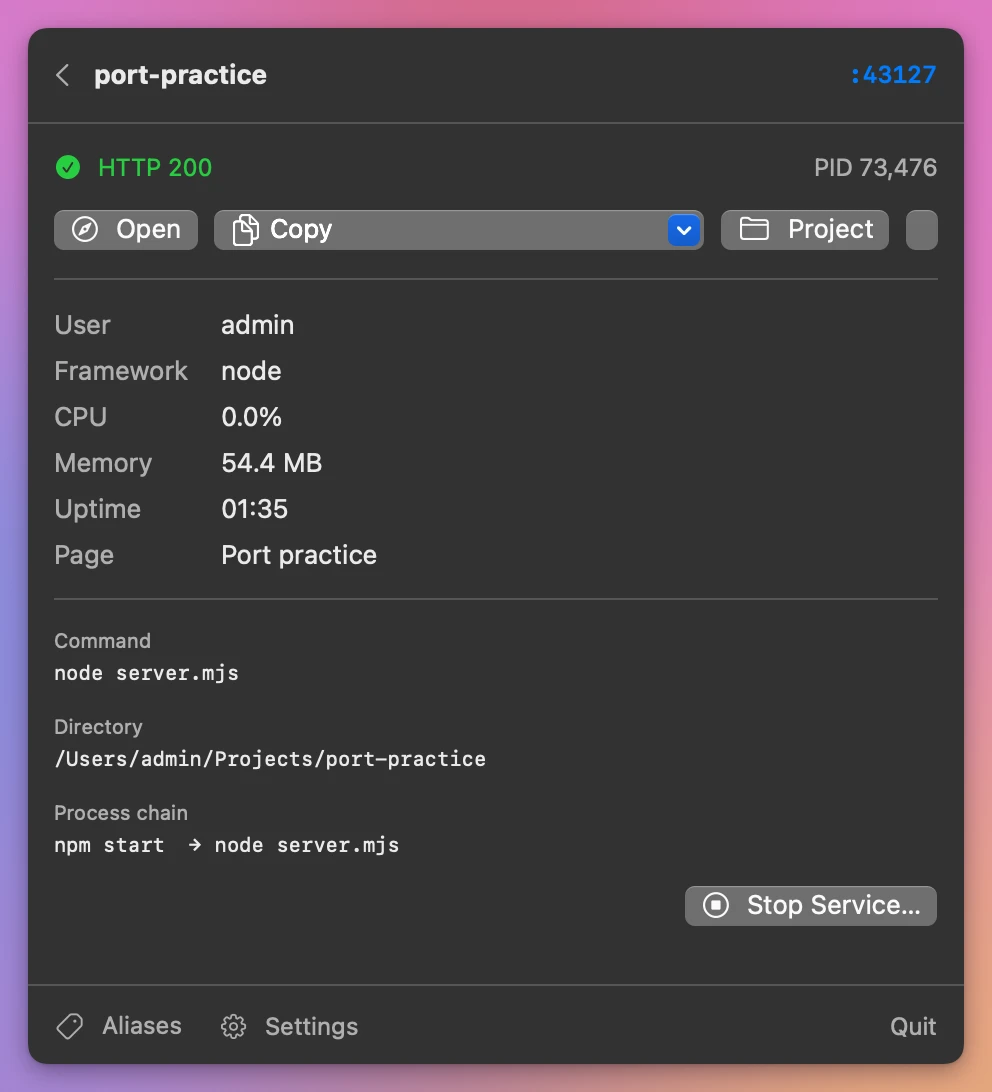
The app remembers the last successful scan, so it shows useful information right away while it refreshes in the background. It can also notify you when a service starts, stops or changes health.
The menu bar app uses the same command-line engine and JSON output as the terminal interface. Port discovery and process safety live in one place instead of in a second port scanner.
Commands for people, scripts, and agents
The dashboard is useful when you are looking at the machine. Coding agents and scripts need predictable commands instead.
You can list the current development services as JSON:
ports list --jsonYou can inspect one port:
ports check 4321 --jsonWithout --json you get the same details in a readable form:
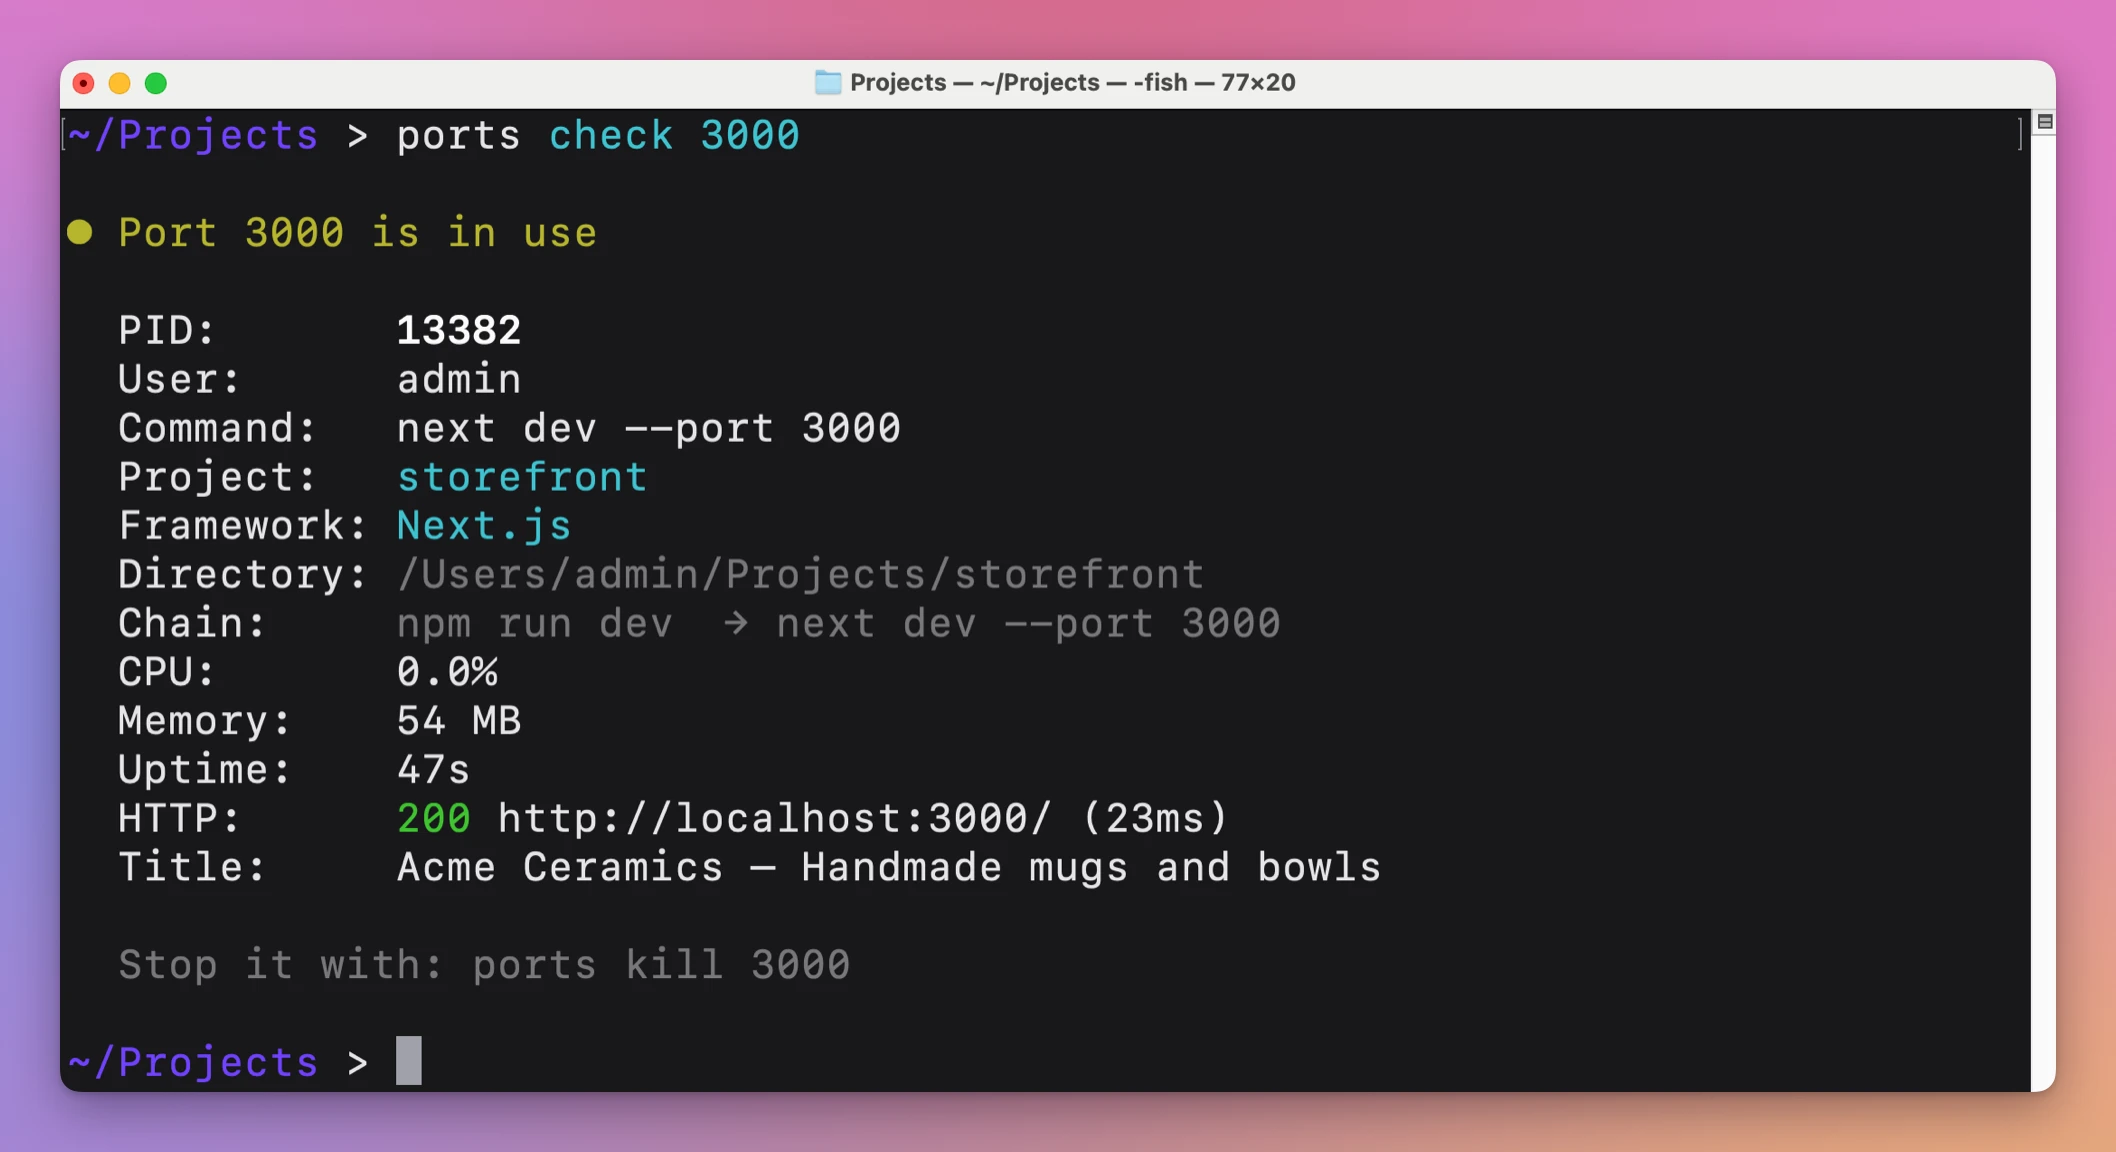
You can test whether a port is available. is-free exits with 0 for a free port and 1 for an occupied one:
ports is-free 4321You can wait until a local server returns the expected HTTP status, or until its port is free again:
ports wait 4321 --http 200 --timeout 60
ports wait 4321 --free
And you can watch for services starting, stopping or changing:
ports watch --jsonAn agent doesn’t need to scrape a colored terminal table or guess whether a server is ready.
Aliases
Give a port a short name and use it everywhere:
ports alias api 8787
ports check api
ports open api
Aliases are saved in your user configuration, outside the project.
Stopping the right process
Stopping processes needed the most care, because a port number alone is not enough information.
Before Port Pilot stops anything, it shows the process, project, directory, command, PID and process chain. The terminal dashboard and command-line flow both require confirmation.
Automation must explicitly pass --yes. Asking for JSON output does not grant permission to stop a process.
Port Pilot finds the descendants of the listening process and stops them before the parent. It starts with SIGTERM, and only sends SIGKILL when a process does not exit after the grace period.
The macOS app follows the same rule. It shows a native confirmation screen, then sends the approved action back through the command-line engine.
A morning with it
- You open the laptop and run
npm run devin the shop project. It fails withEADDRINUSEon 3000. - Run
ports check 3000. It’s the Next.js storefront from Friday, started in~/dev/storefront, throughnpm run dev. - You’re done with it, so run
ports kill 3000. Read the preview: the process tree, the directory, the command. Confirm. - Start the shop again. It gets 3000.
- Open the menu bar app. The webhooks worker shows
503. Click it, open its project, fix the bug, and watch the status turn200. - Before your test run,
ports wait 3000 --http 200 --timeout 60holds until the shop answers.
By hand, steps 2 and 3 are lsof -i :3000, then ps on the PID, then its parent, then lsof -p to find the working directory, then a kill with the right PID. Port Pilot gives you all of that in one command.
Why not use lsof and kill
lsof -i :3000 tells you the PID and process name. ps gives the full command. docker ps shows published ports. These tools are free and already on your Mac, and for a single check they work.
The trouble is putting the pieces together. lsof says node, which is every JavaScript server you run. Finding the project means another command for the working directory. Finding what started it means walking up the parent processes. And kill on one PID can leave its child processes running, or hit the wrong node.
lsof, ps and kill | Port Pilot | |
|---|---|---|
| Which project owns a port | Look up the PID’s working directory | Shown next to the port |
| Is it healthy | curl it yourself | HTTP status and response time |
| Docker-published ports | Separate docker ps | Container, image and private port |
| Stopping a dev server | Find the right PID and its children | Previews the whole tree, children first |
| Waiting for a server in a script | A loop with curl and sleep | ports wait --http 200 |
| Output for agents | Text to parse | JSON and exit codes |
If you also want each project on a stable address instead of a port number, Local Hoster gives it one like https://shop.localhost.
What it doesn’t do
- It doesn’t free a port automatically. Stopping a process always needs your confirmation, or an explicit
--yes. - It doesn’t scan other computers. It shows listeners on the machine it runs on.
- It doesn’t run on Windows. The CLI works on macOS and Linux. The menu bar app is macOS only.
- It doesn’t start or restart your servers. It finds, checks and stops them.
- It doesn’t send anything anywhere. Process details and HTTP health results stay on your computer.
Questions
What do I need?
The command-line tool supports macOS and Linux. The native menu bar companion requires macOS 13 or newer.
You need Node.js 20 or newer; Node.js 24 is a suitable LTS release. Docker support is optional. Port scanning uses lsof on macOS, and ss or lsof on Linux.
Does it need an account or a server?
No. Port Pilot reads the current state of your computer. It does not need an account, API key, database or hosted service.
The command-line tool only saves optional aliases to a local configuration file. The macOS app keeps its preferences and last successful scan on your Mac.
A service is missing from the list. Why?
The default view shows development services only. Turn on Show all in the menu bar app, or pass --all, to include system and unknown listeners.
Do I need the menu bar app?
No. It’s optional. The dashboard and the ports command work on their own, and the menu bar app uses the same CLI underneath.
The setup steps cover installing the CLI and the menu bar app.
What you get
Port Pilot costs $20 including tax, paid once. The purchase includes the ready-to-install ZIP.
Download the runtime ZIP from your purchase page. Reopen that page for later versions.
The ZIP includes the signed Mac menu bar app and the packaged CLI.
The download includes:
- the installable command-line tool
- the React and Ink terminal dashboard
- the notarized Mac menu bar app
- macOS and Linux port scanners
- HTTP health and Docker integration
- JSON commands, exit codes, waits, watch events, aliases, and shell completions
- setup instructions