Track deploys and errors as events with KPI insight cards
By Flavio
Updated
Log every deploy and backend error to Events Logger from a shell script and Node, then keep “Deploys today” and “Errors today” cards up to date.
You deployed three times today, and one of those deploys broke checkout. By the time you notice, you can’t remember which version went out when, or whether the errors started before or after it.
Error trackers and deploy dashboards solve this, but they’re one more hosted service with your data in it. If you already run Events Logger for signups and orders, it can hold deploys and errors too, in the same SQLite file on your own machine.
We’ll wire up two things. A deploy script that logs a deploys event when the deploy works and an errors event when it fails. And a small Node function that logs backend exceptions. Then we’ll turn the counts into two insight cards, Deploys today and Errors today, that a second script keeps current.
At the end, the Feed shows every release next to the errors that followed it, and the Insights tab shows today’s numbers at a glance.
What you need
Events Logger runs on Node.js. The app page lists Node.js 18 or later, but the bundled SQLite driver, better-sqlite3 12, declares support for Node 20 and newer, so use Node 20 or later. You also need npm.
After buying, download the source zip from your Polar receipt and unzip it. From that folder, install the dependencies and start the dashboard:
npm install
mkdir -p data
npm run dev
It runs at http://localhost:4321. On the first start it creates data/events.db and one API key for the whole installation, which starts with ev_ and is shown on the home page. If you haven’t sent an event before, Send signup and order events from your app to your own dashboard walks through the first one.
The dashboard has no login, and it shows the API key on its home page. Keep it on your Mac, or behind a private network with its own authentication. That also decides where you can log from: a deploy script on your Mac can reach localhost, a CI runner on GitHub can’t.
The scripts below use jq to read JSON. If which jq prints nothing, install it with brew install jq. The jq command covers the basics.
As a preflight check, confirm the CLI that ships in the source answers:
node cli/index.js --helpUsage: events-cli [options] [command]
Push events and insights to your Events Logger
Options:
-V, --version output the version number
-h, --help display help for command
Commands:
init [options] Create a new project
push [options] Push an event
insight [options] Create or update an insight
export [options] Export all data to a JSON file
load [options] Load data from a JSON file (replaces all existing data)
help [command] display help for commandIf you get Cannot find module 'commander' instead, run npm install in that folder first.
Create a project for the app you deploy
Events Logger groups everything by project. Each project has its own feed, charts and insight cards, and an insight card belongs to exactly one project. If you log deploys from two apps into the same project, Deploys today mixes them, and you can’t tell which app had the bad day. So give each app you ship its own project, even if it only ever receives deploys and errors. The project ID is what every command below sends, and a wrong ID is the most common reason an event doesn’t show up where you expect it.
Put the API key in a shell variable first, so it doesn’t end up in your shell history in every command:
export EVENTS_API_KEY=ev_...
node cli/index.js init --api-key "$EVENTS_API_KEY" --name "Recipe Box"
Project created: Recipe Box
ID: resxgauntfis
Push events with:
events-cli push --api-key ev_... --project resxgauntfis --category signups --title "User Registered"Every installation generates its own IDs, so yours will differ. “Recipe Box”, its version numbers and the commit hashes below are example values from a test install. The project’s Playground tab shows the same ID if you lose it.
Notice that the last line prints the API key back, in full. Don’t paste that output into a chat or an issue.
There’s nothing to set up for the deploys and errors categories. The first event that uses a category creates it.
Log every deploy from your deploy script
A deploy you didn’t log is a gap in the timeline. When errors start at 14:05, you want to see a deploy at 14:03 right above them in the feed, with the version and the commit. The reliable place for that is the script you already use to deploy, because it’s the one place that knows whether the deploy worked. If you log from memory, you’ll forget the hotfix you pushed at midnight. And if you log before the deploy runs, a failed deploy shows up as a release that never happened, which is worse than no entry at all.
This wrapper runs your project’s npm run deploy, then pushes one event with the CLI. The --tags value must be a JSON object, so the script builds it from the version in package.json and the short commit hash:
#!/bin/sh
# deploy.sh, in the root of the app you deploy
EVENTS_CLI=/Users/flavio/apps/events-logger/cli/index.js
PROJECT=resxgauntfis
version=$(node -p "require('./package.json').version")
commit=$(git rev-parse --short HEAD)

if npm run deploy --silent; then
  node "$EVENTS_CLI" push --api-key "$EVENTS_API_KEY" --project "$PROJECT" \
    --category deploys --title "Deployed v$version" --icon "🚀" \
    --tags "{\"version\":\"$version\",\"commit\":\"$commit\"}"
else
  node "$EVENTS_CLI" push --api-key "$EVENTS_API_KEY" --project "$PROJECT" \
    --category errors --title "Deploy of v$version failed" --icon "🔥" --notify \
    --tags "{\"version\":\"$version\",\"commit\":\"$commit\"}"
  exit 1
fi
/Users/flavio/apps/events-logger is an example path. Use the folder where you unzipped Events Logger. The CLI talks to http://localhost:4321 by default. If your dashboard runs elsewhere, add --url with its address to both push lines.
Example 1: a successful deploy. In the Recipe Box example, npm run deploy uploads the build and prints its own line. Then the CLI confirms the event:
./deploy.shUploading dist/ ... done
Event pushed: Deployed v1.4.4 [deploys]The first line comes from the example deploy command, so yours will be whatever your deploy prints. The second line is the CLI.
The failed branch adds --notify. That highlights the event in the feed, and if you turned on notifications with the bell button in the feed, the browser shows one too. It also ends with exit 1, so anything that runs deploy.sh still sees the failure.
Run it twice and you get two events. The API has no deduplication, so every run is a new row, which is what you want for a deploy log.
Log backend errors with the release that caused them
A deploy event on its own tells you something changed. The errors after it tell you whether the change hurt. The trick that connects the two is a shared tag. If every error carries the release it happened in, one search for 1.4.4 finds the deploy and every error that came after it. Without that tag, you’re comparing timestamps by eye. The other half is making sure reporting can never break the request it’s reporting on. If the dashboard is down or slow, the error should still be handled normally, and the user shouldn’t wait for your logging.
This function goes in your Node backend. It reads the key, the project ID and the dashboard URL from the environment, and the release from a RELEASE variable you set at deploy time:
export async function reportError(error, route) {
  try {
    const response = await fetch(`${process.env.EVENTS_URL}/api/events`, {
      method: 'POST',
      signal: AbortSignal.timeout(5000),
      headers: {
        'Content-Type': 'application/json',
        Authorization: `Bearer ${process.env.EVENTS_API_KEY}`,
      },
      body: JSON.stringify({
        project: process.env.EVENTS_PROJECT_ID,
        category: 'errors',
        title: `${error.name} in ${route}`,
        icon: '🔥',
        notify: true,
        tags: { route, release: process.env.RELEASE ?? 'unknown' },
      }),
    })
    if (!response.ok) console.error(`Event request failed: ${response.status}`)
  } catch (failure) {
    console.error(`Could not report the error: ${failure.message}`)
  }
}
Call it from your error handler with the error and the route, like reportError(error, 'POST /api/checkout'). The 5-second timeout and the try keep a stopped dashboard from turning one error into two.
Notice what it doesn’t send: error.message. The description is rendered as HTML without escaping, and messages often contain what the user typed. The first Events Logger tutorial shows a script running in the dashboard that way. The error name and the route are values you control.
I ran it against a local dashboard with RELEASE=1.4.4, once normally, once with the dashboard URL pointing at a closed port, and once with a wrong key:
Could not report the error: fetch failed
Event request failed: 401
The normal run printed nothing, because the request got a 201. The other two printed one line each and returned.
Now search the errors for the release. The search matches titles, descriptions and tags:
curl --fail-with-body --silent --get http://localhost:4321/api/events \
  --data-urlencode 'project=resxgauntfis' \
  --data-urlencode 'category=errors' \
  --data-urlencode 'search=1.4.4'
{
"events": [
{
"id": 7,
"title": "TypeError in POST /api/checkout",
"tags": "{\"route\":\"POST /api/checkout\",\"release\":\"1.4.4\"}",
"createdAt": "2026-11-09T08:39:34.000Z"
},
{
"id": 6,
"title": "Deploy of v1.4.4 failed",
"tags": "{\"version\":\"1.4.4\",\"commit\":\"70b125f\"}",
"createdAt": "2026-11-09T08:39:26.000Z"
}
],
"nextCursor": null
}I kept two of the three results and four fields per event. The failed deploys shows up too, because the deploy script tags errors events with the version. tags comes back as a JSON string, not an object.
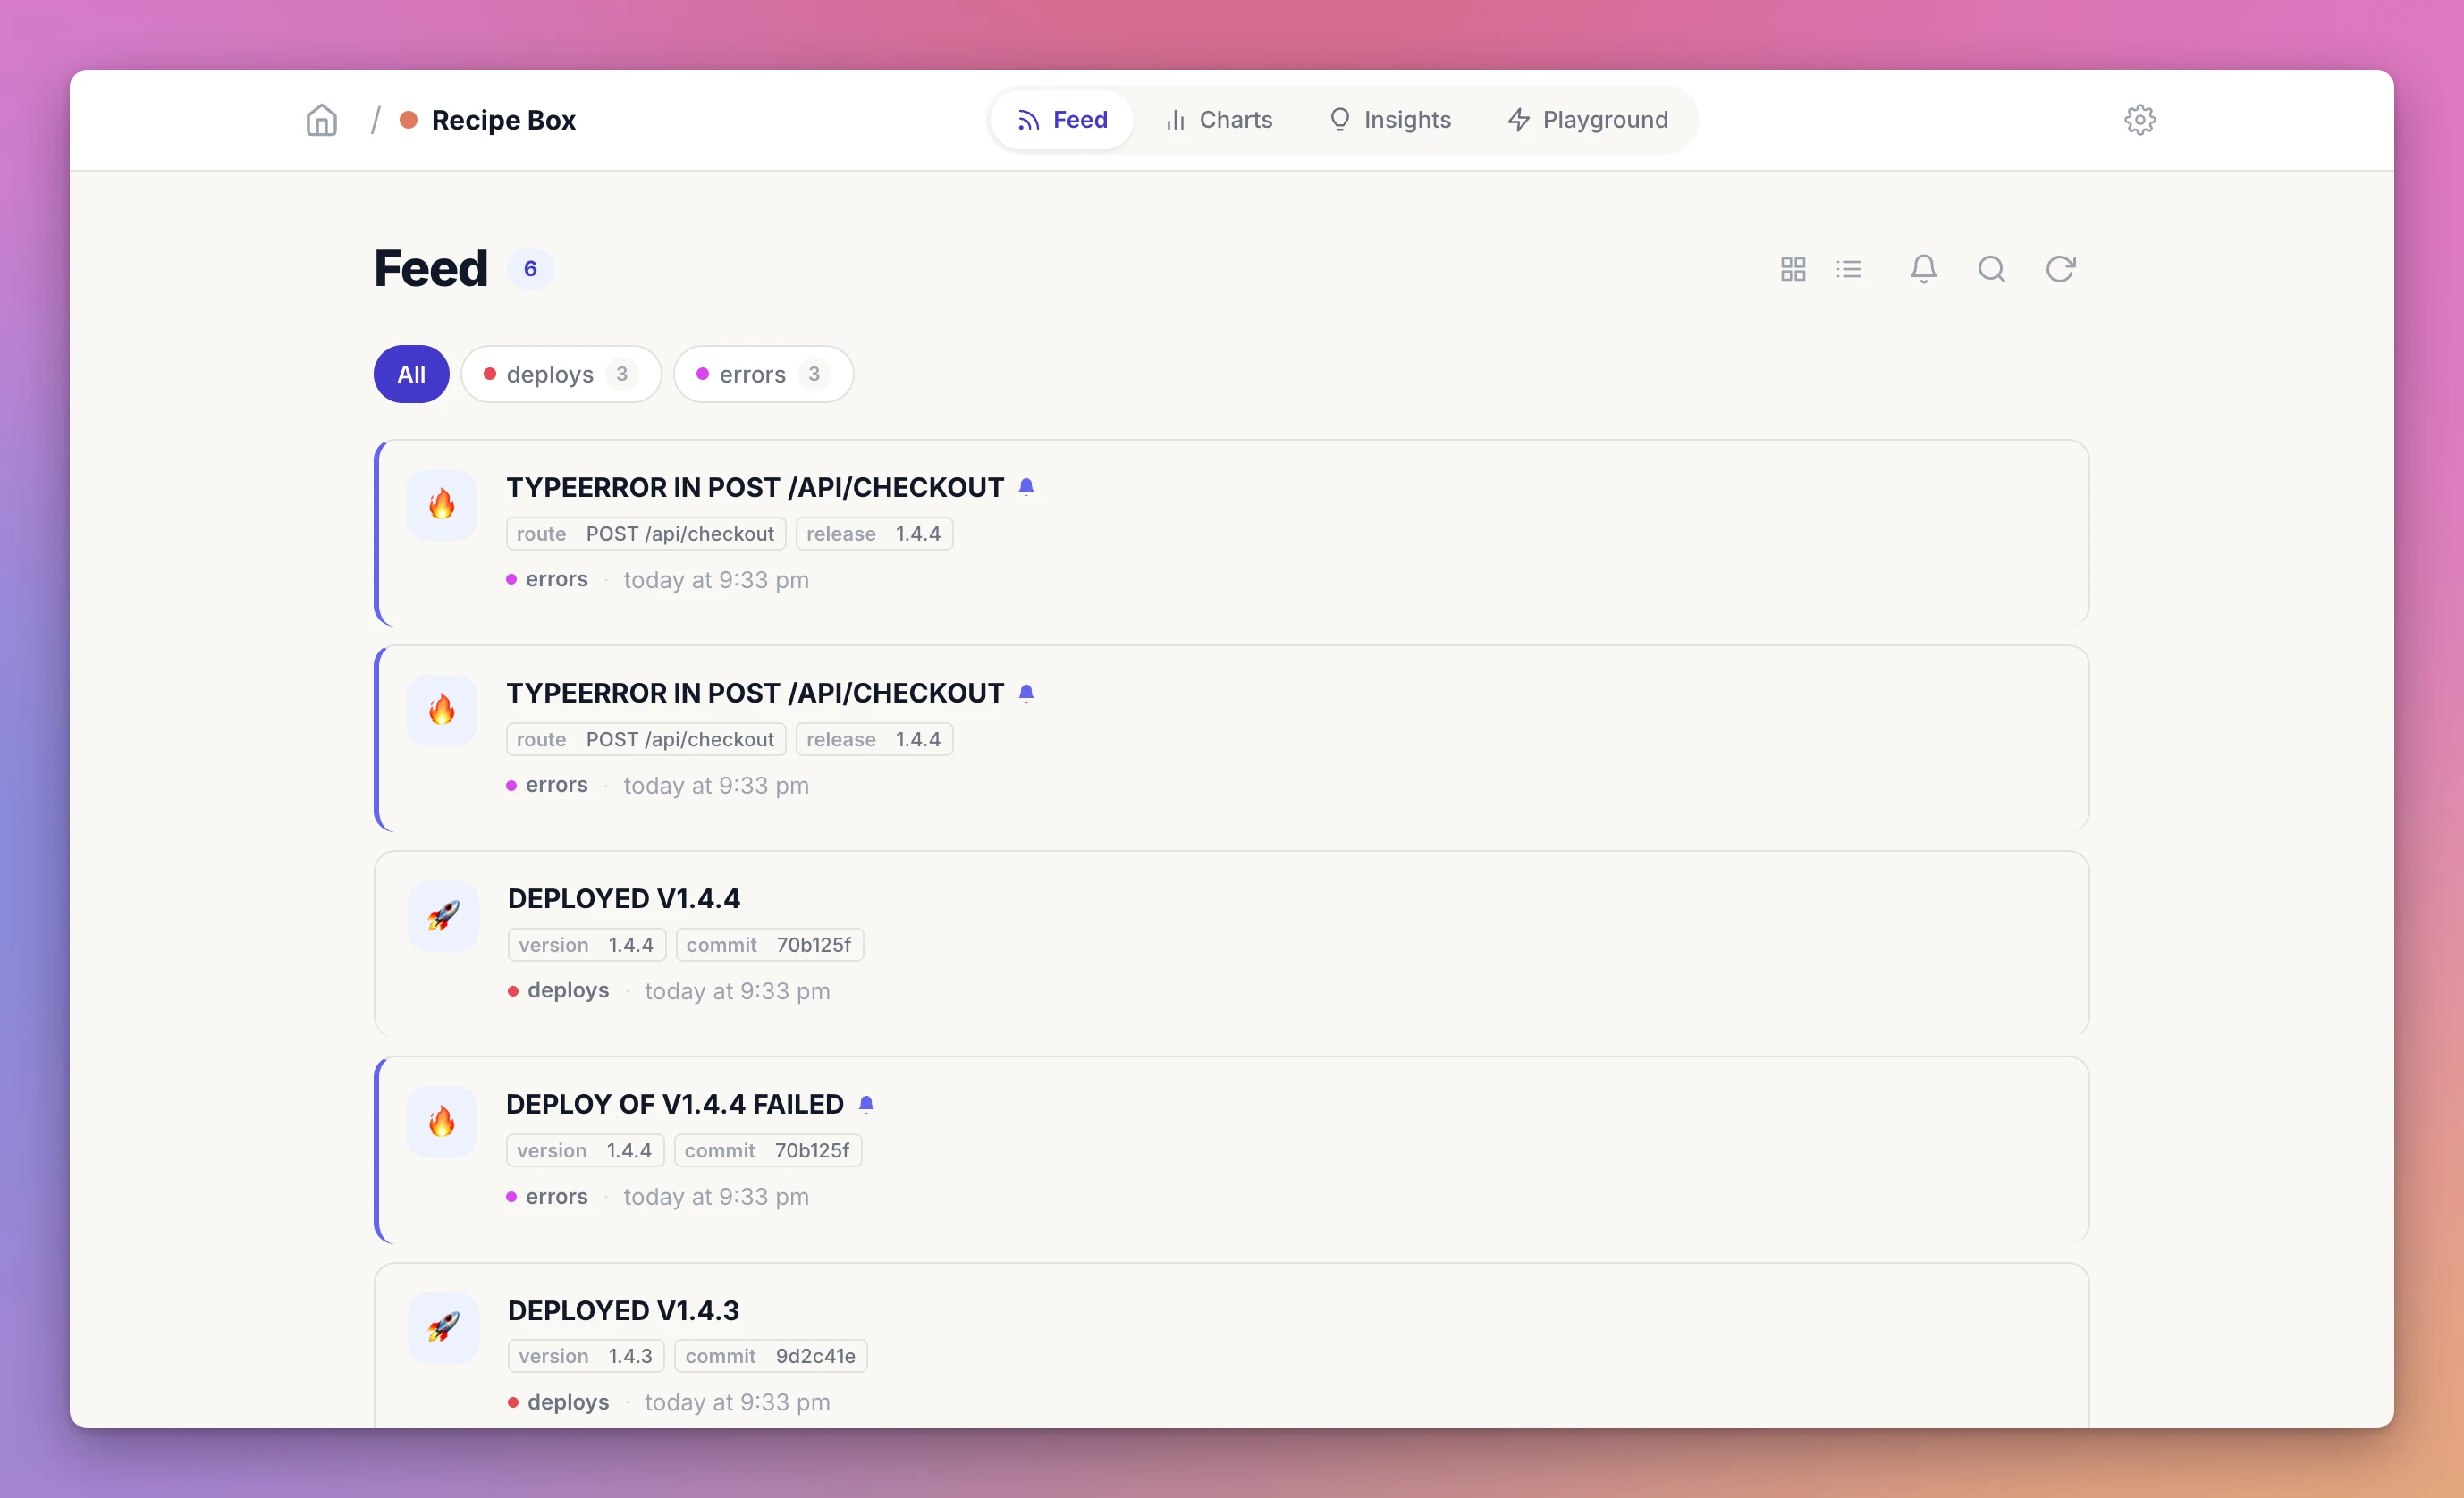
If you’d rather click, the Feed tab shows the same events, newest first. This is the Recipe Box project after three deploys and three errors. The events sent with notify have a bell next to the title and a colored edge:
Turn the counts into insight cards
The feed is a log. You read it when something is wrong. An insight card is the opposite: one number you glance at, like Errors today: 3. Events Logger doesn’t compute cards from events. A card is a title and a value that you post, and the dashboard displays whatever you sent last. That’s flexible, but it means something has to do the counting. If nothing updates the card, it keeps showing yesterday’s number, and the Updated line under it is the only hint that it’s stale.
The counting is already done for you by the charts endpoint. GET /api/charts returns event counts grouped by category and day:
curl --silent "http://localhost:4321/api/charts?project=resxgauntfis&days=2"{"deploys":[{"day":"2026-11-09","count":3}],"errors":[{"day":"2026-11-09","count":3}]}Here’s the mechanism worth knowing. The days are computed in UTC, from the stored Unix timestamp. In Rome, a deploy at 00:30 on November 10 is still counted on November 9. So the script below picks today’s UTC date with date -u, to match.
And this is how a card gets updated. POST /api/insight looks for a card with the same title in the same project. If it finds one, it replaces the value. If not, it creates a new card. The CLI’s insight command sends that request:
#!/bin/sh
# update-cards.sh
set -e
URL=http://localhost:4321
PROJECT=resxgauntfis
EVENTS_CLI=/Users/flavio/apps/events-logger/cli/index.js
today=$(date -u +%F)

counts=$(curl --fail-with-body --silent "$URL/api/charts?project=$PROJECT&days=2")
deploys=$(echo "$counts" | jq --arg d "$today" '[.deploys[]? | select(.day == $d) | .count] | add // 0')
errors=$(echo "$counts" | jq --arg d "$today" '[.errors[]? | select(.day == $d) | .count] | add // 0')

node "$EVENTS_CLI" insight --api-key "$EVENTS_API_KEY" --project "$PROJECT" --url "$URL" \
  --title "Deploys today" --value "$deploys" --icon "🚀"
node "$EVENTS_CLI" insight --api-key "$EVENTS_API_KEY" --project "$PROJECT" --url "$URL" \
  --title "Errors today" --value "$errors" --icon "🔥"
The []? and // 0 parts make a category with no events today count as 0 instead of failing.
./update-cards.shInsight updated: Deploys today = 3
Insight updated: Errors today = 3The CLI prints Insight updated both when it creates a card and when it changes one. Run the script again after another deploy and the same two cards change. No new cards appear.
Example 2: a card that isn’t a count. The value is stored as text, so a card can hold anything short. I like a Last deploy card with the version and commit. Add this line to the success branch of deploy.sh:
node "$EVENTS_CLI" insight --api-key "$EVENTS_API_KEY" --project "$PROJECT" \
  --title "Last deploy" --value "v$version ($commit)" --icon "📦"
Insight updated: Last deploy = v1.4.4 (70b125f)This card doesn’t need the counting script. It changes exactly when a deploy succeeds, and its Updated line tells you how long ago that was.
Read the cards and the charts
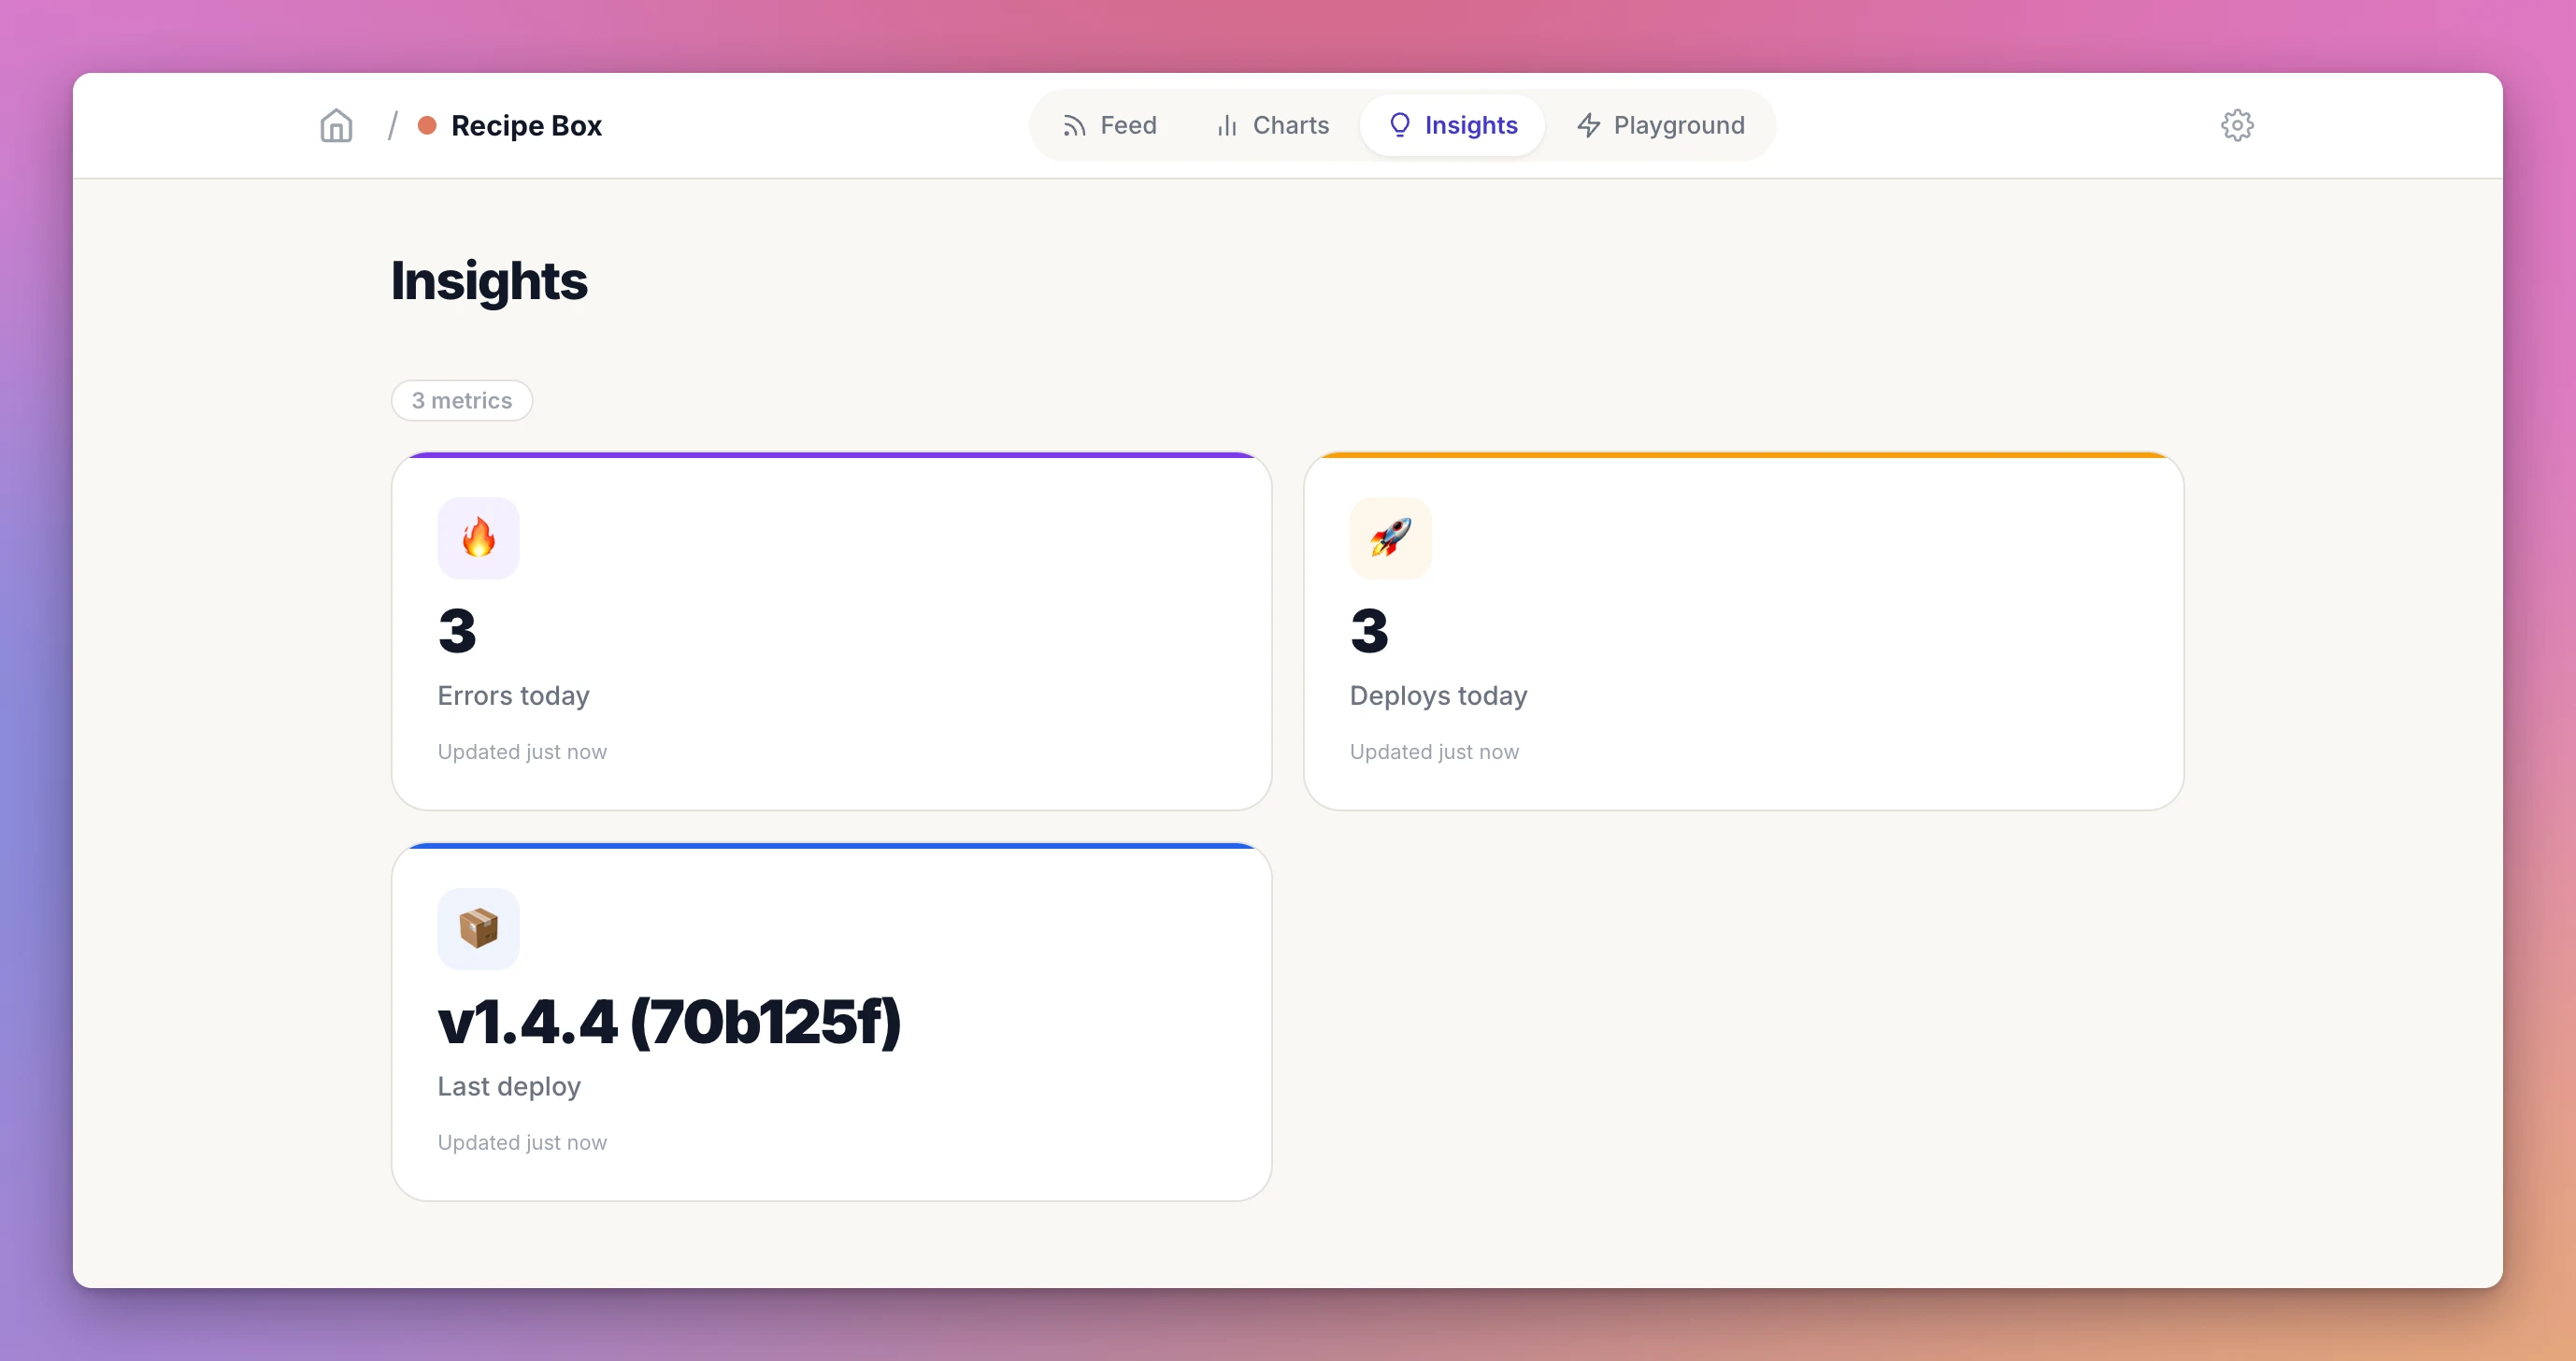
Open the project and click Insights. Each card shows the icon, the value in large type, the title, and a line like Updated just now or Updated 3h ago. The page reloads the cards every 15 seconds, so you can leave it open next to your terminal while you deploy. A counter above the cards says how many there are, and the most recently updated card comes first. That ordering is useful: after a deploy, the cards your scripts touched move to the top.
Earlier in my run, before the Last deploy card existed, the page rendered this text:
Insights

2 metrics

🚀  2
    Deploys today
    Updated just now

🔥  3
    Errors today
    Updated just now
In the real page each card is a box with a colored bar on top, laid out in a grid. Here’s the page once the Last deploy card was there too:
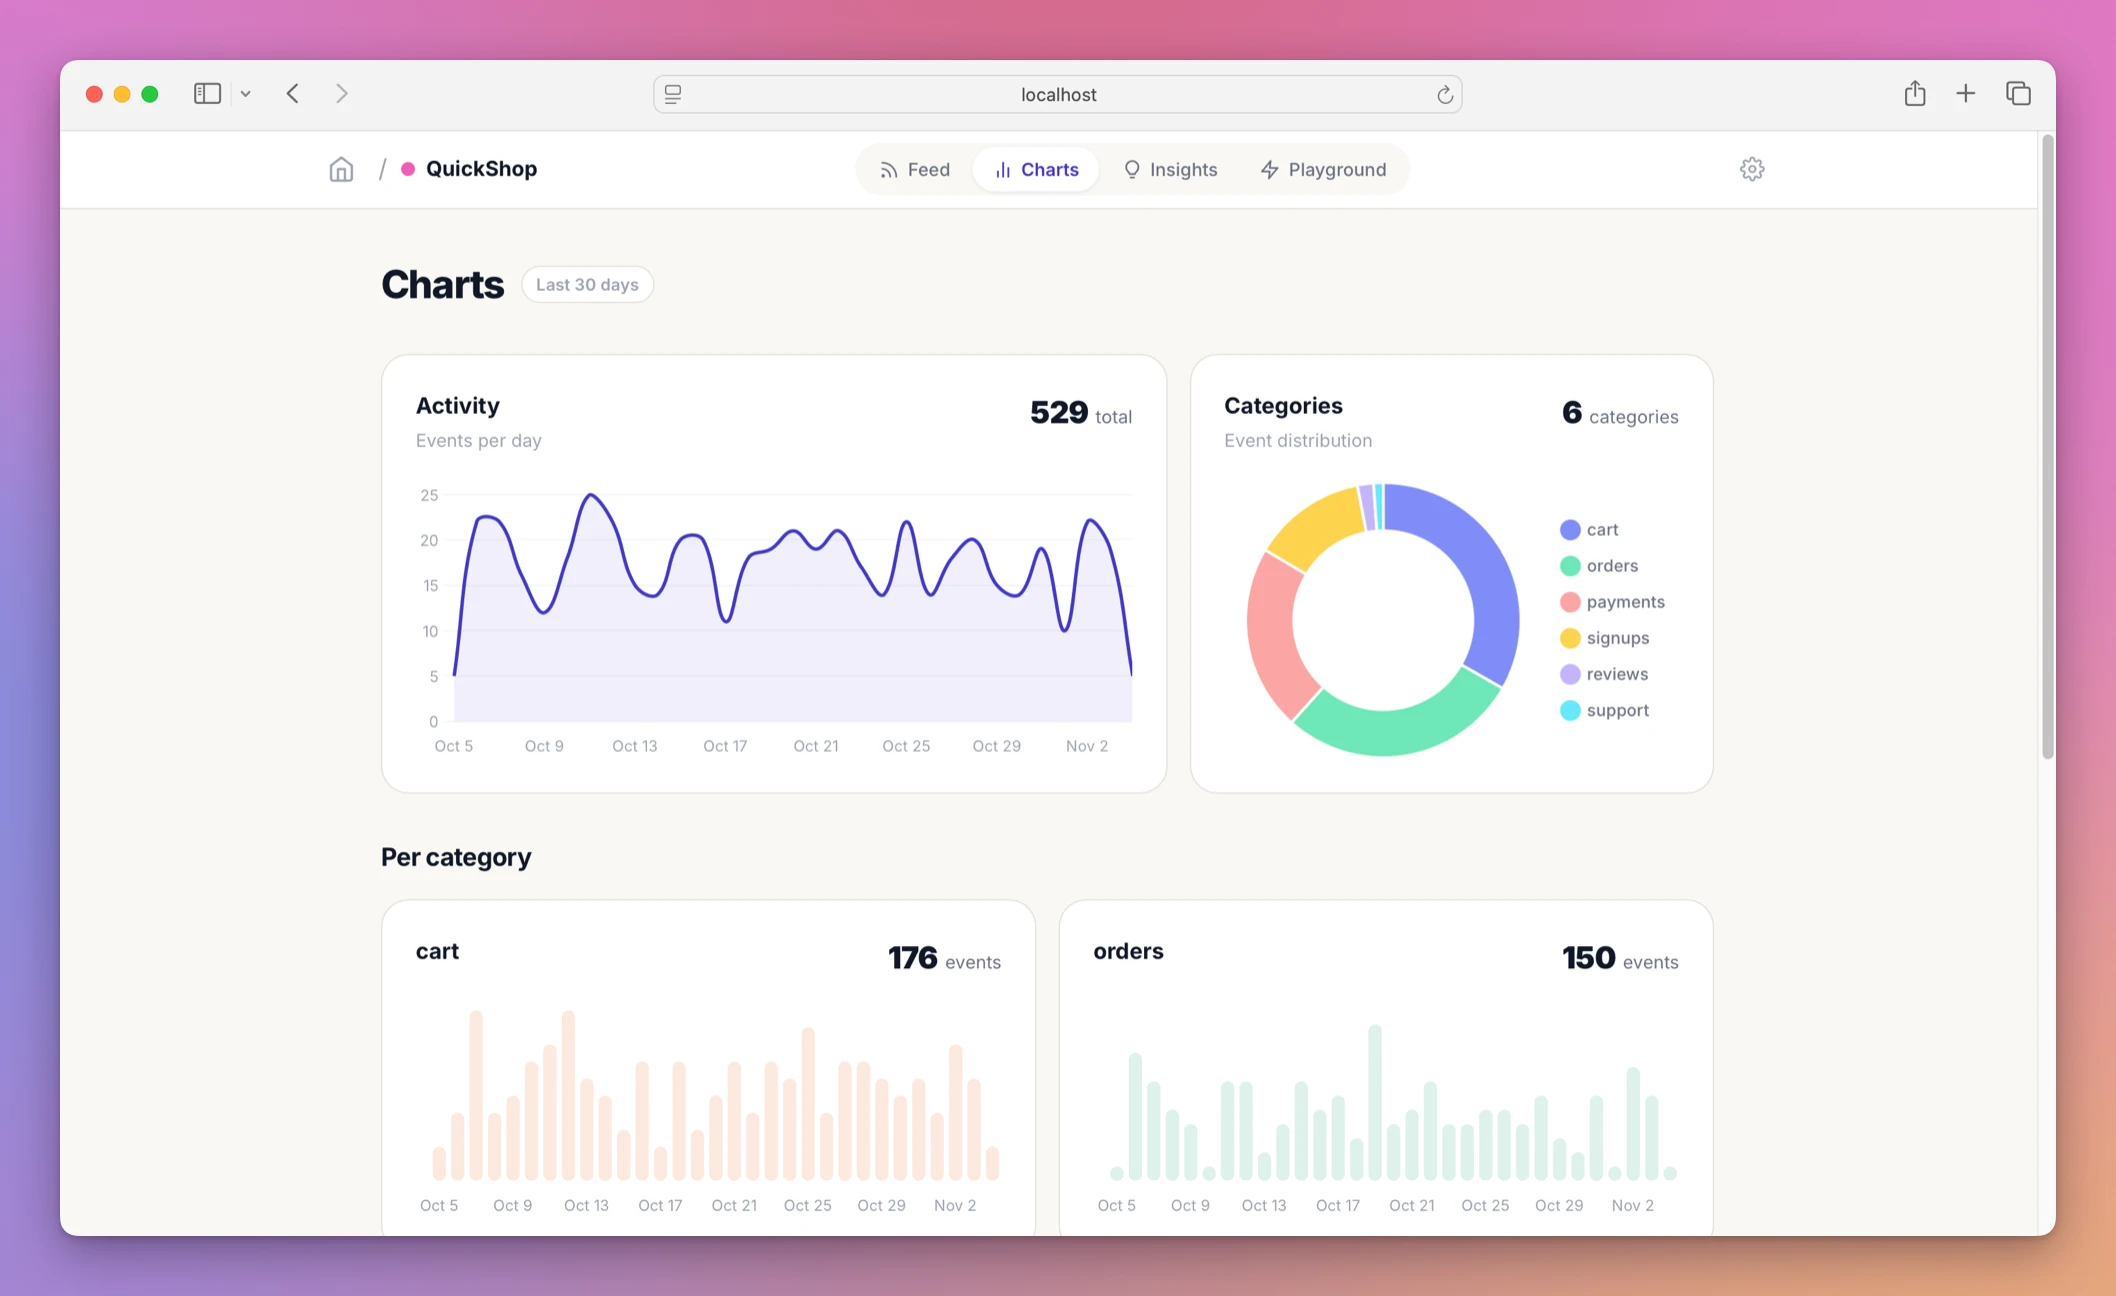
The Charts tab answers a different question: not “how many today” but “is this getting worse”. It shows events per day for each category over the last 30 days. A week where the errors bars grow after every deploys bar is a pattern no single card will show you. This is the tab for QuickShop, a project in the app’s demo data, with a month of events:
The Feed refreshes every 10 seconds. Filter it by the errors category during a deploy, and the events with notify stand out with their highlight.
Cards only change when you post to them. If you deploy from your Mac a few times a day, run update-cards.sh at the end of deploy.sh. For errors that happen while you’re away, schedule it. How to schedule cron jobs on Linux and macOS covers the syntax; this line runs it every 15 minutes:
*/15 * * * * EVENTS_API_KEY=ev_... /Users/flavio/apps/events-logger/update-cards.shCron starts with a minimal environment, which is why the key is set on the line. If the script fails under cron but works in your terminal, use full paths to node and jq in it.
Remove a card or start over
Sooner or later you’ll rename a card, or decide a metric isn’t worth watching. The catch is that cards are matched by exact title, and the match is case-sensitive. Post deploys today once by mistake and you get a second card next to Deploys today, holding its own value, and the script keeps updating the original. Nothing breaks, but the dashboard now shows two numbers that look like the same thing. And removing a card that a script still posts to doesn’t last, because the next run creates it again.
To remove a card, hover it on the Insights tab and click the × button in its corner, labelled Remove metric. The browser asks Remove this metric? first. Click OK and the card is deleted. There’s no undo in the app, so remove the title from your scripts first, then delete the card.
Deleting a card doesn’t touch any event. Your deploy and error history stays in the feed, and the counts come from the events, not from the cards.
To keep a copy before you clean up, export everything to JSON. This reads the SQLite file directly, so run it from the Events Logger folder:
node cli/index.js export --file backup.jsonExported to backup.json
1 projects, 2 categories, 3 events, 2 insightsI ran that early in my test, with three events and two cards. The export holds projects, categories, events and insights. load can put them back, but it replaces all existing data by default. Use --merge to merge instead, and restart the server after loading.
Example 3: the card update that fails. I ran the insight command with a key that isn’t this installation’s:
node cli/index.js insight --api-key wrongkey --project resxgauntfis \
  --title "Deploys today" --value 3
Error: Invalid API keyIt exits with 1, and set -e in update-cards.sh stops the script there. The fix is to copy the current key from the home page into EVENTS_API_KEY. The usual cause is a wiped data/ folder: a new database always gets a new key.
If something looks wrong
- If the CLI prints
Could not connect to http://localhost:4321. Is the server running?, start the dashboard withnpm run dev, or pass--urlwith the address where it runs. - If you get
Error: Invalid API key, the key inEVENTS_API_KEYisn’t this installation’s key. Copy it again from the home page. - If you get
Error: Project not found, the project ID doesn’t exist on this installation. Check it in the project’s Playground tab. - If
insightstops witherror: required option '--value <value>' not specified, the command has no--value. Every card update needs one, even when only the icon changes. - If
pushcrashes withSyntaxErrorandis not valid JSON, the--tagsvalue isn’t a JSON object. Keys and values need double quotes, escaped inside the shell string. - If a second card appears with almost the same name, the titles differ in case or spacing. Fix the title in the script, then remove the extra card.
- If Errors today shows a lower number than you expect just after midnight, remember the days are in UTC. Events from before midnight UTC count on the previous day.
- If a card shows Updated 2h ago while you deployed since, the script that updates it didn’t run. Run
update-cards.shby hand and read its output.
Get Events Logger
Track signups, orders, deploys and errors in your own SQLite dashboard. Includes an HTTP API, CLI, charts and full MIT source.
See Events Logger → · Read the docs · $20 including tax, with full source code.
Want me to talk about your product? You can sponsor this site.