Use the Chrome DevTools to debug a Node.js app
By Flavio Copes
Learn how to debug a Node.js app with the Chrome DevTools by running node --inspect and opening about://inspect to attach the full debugger and profiler.
With client-side code it’s easy to start debugging some piece of code - just open the Chrome DevTools on any page, and start writing client-side JavaScript.
How can we do the same with Node.js code, and debug Node modules with access to the filesystem and other Node.js capabilities? It’s very simple, actually.
Open your terminal and run
node --inspect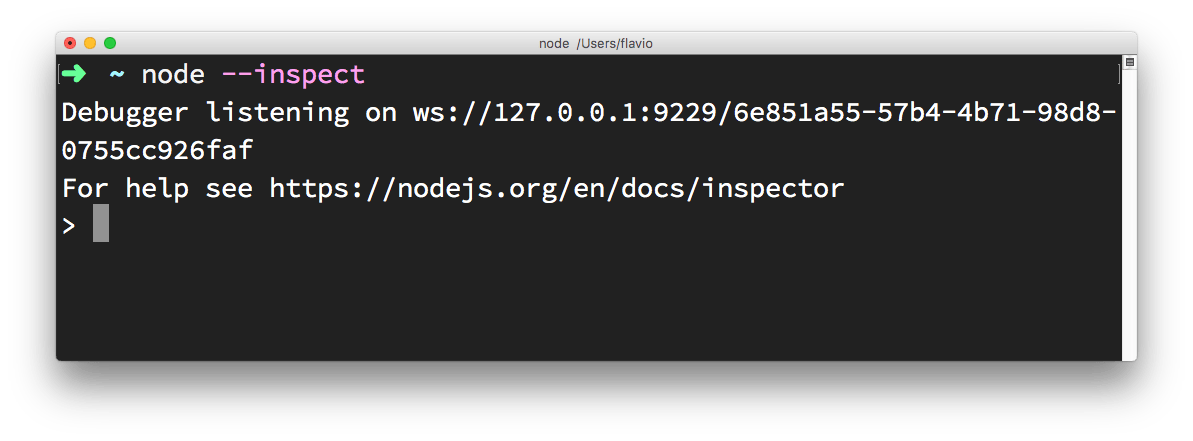
Then in Chrome type this URL: about://inspect.
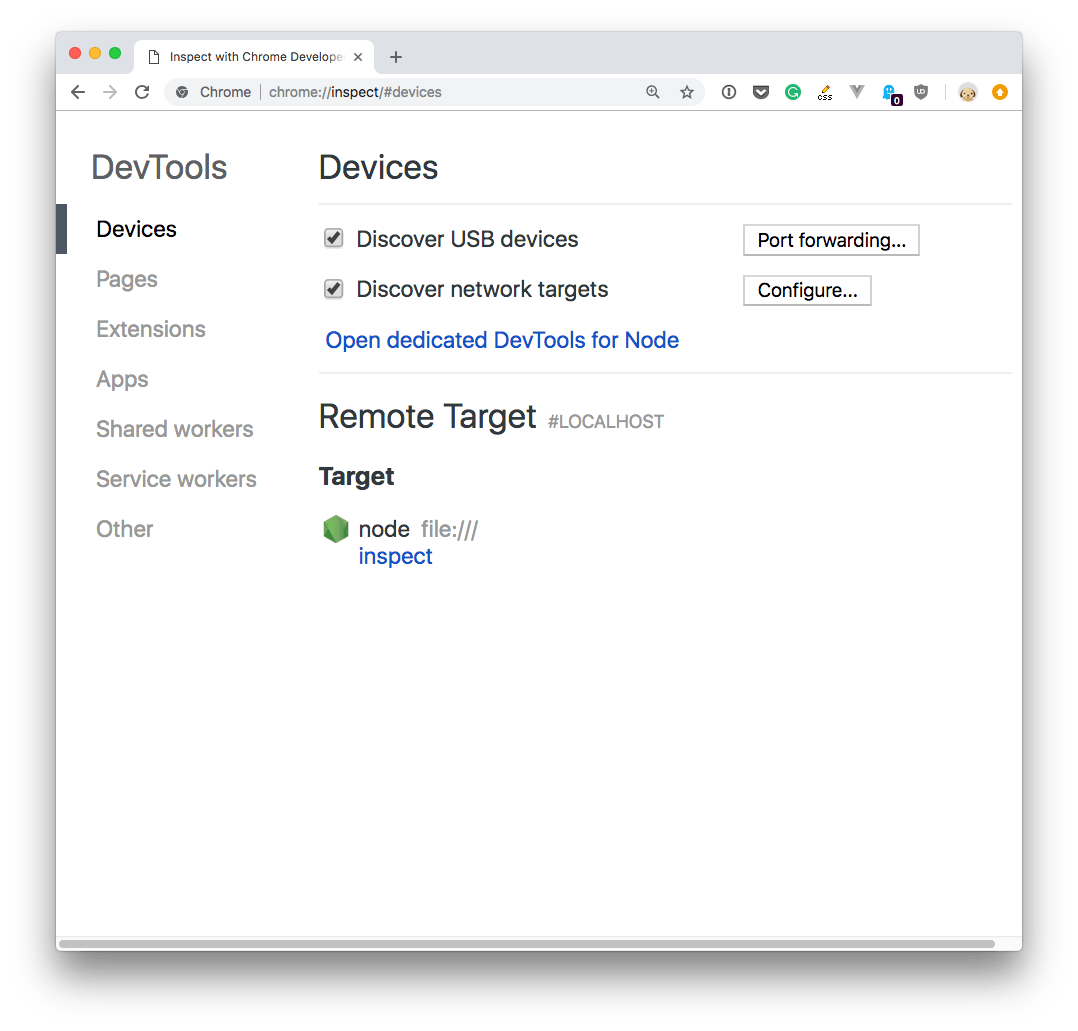
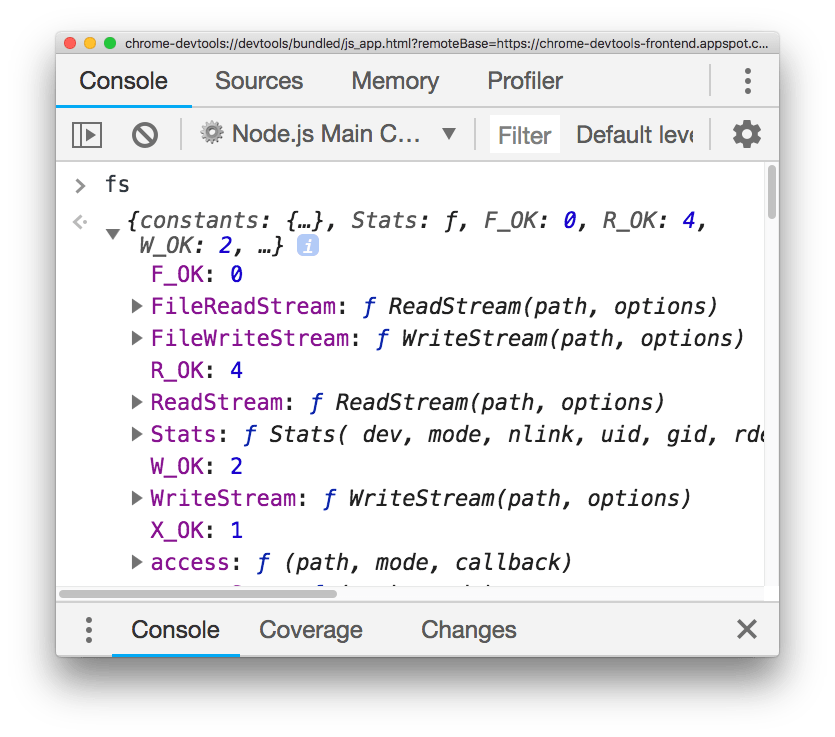
Click the Open dedicated DevTools for Node link next to the Node target, and you’ll have access to Node.js in the browser DevTools:
Make sure you click that, and not the inspect link down below, as it tool auto-reconnects to the Node.js instance when we restart it - pretty handy!
If the question is why we want to do that, it’s pretty simple: there’s no better way to debug any JavaScript code than using the DevTools and their tools. We have access to the profiler, all the stack visualization information, the code navigation facilities, a very cool debugger and much more!
Related posts about node: